E-commerce Email Marketing Benchmarks: Open, Click, and Conversion Rates by Industry
Written by
Editorial TeamPublished on
Email marketing benchmarks by Klaviyo reveal how your e-commerce performance compares to industry standards. Explore open, click, and conversion rates and uncover opportunities for growth. (Ad)
Wondering how your e-commerce store stacks up in your customers’ inboxes? Without data-driven context, it is difficult to gauge whether your digital marketing efforts are truly yielding top-tier results or simply falling short. Are your open rates on par with competing fashion brands? Do your newsletters generate fewer clicks than other beauty brands? And are your conversions looking as healthy as the food and beverage industry next door?
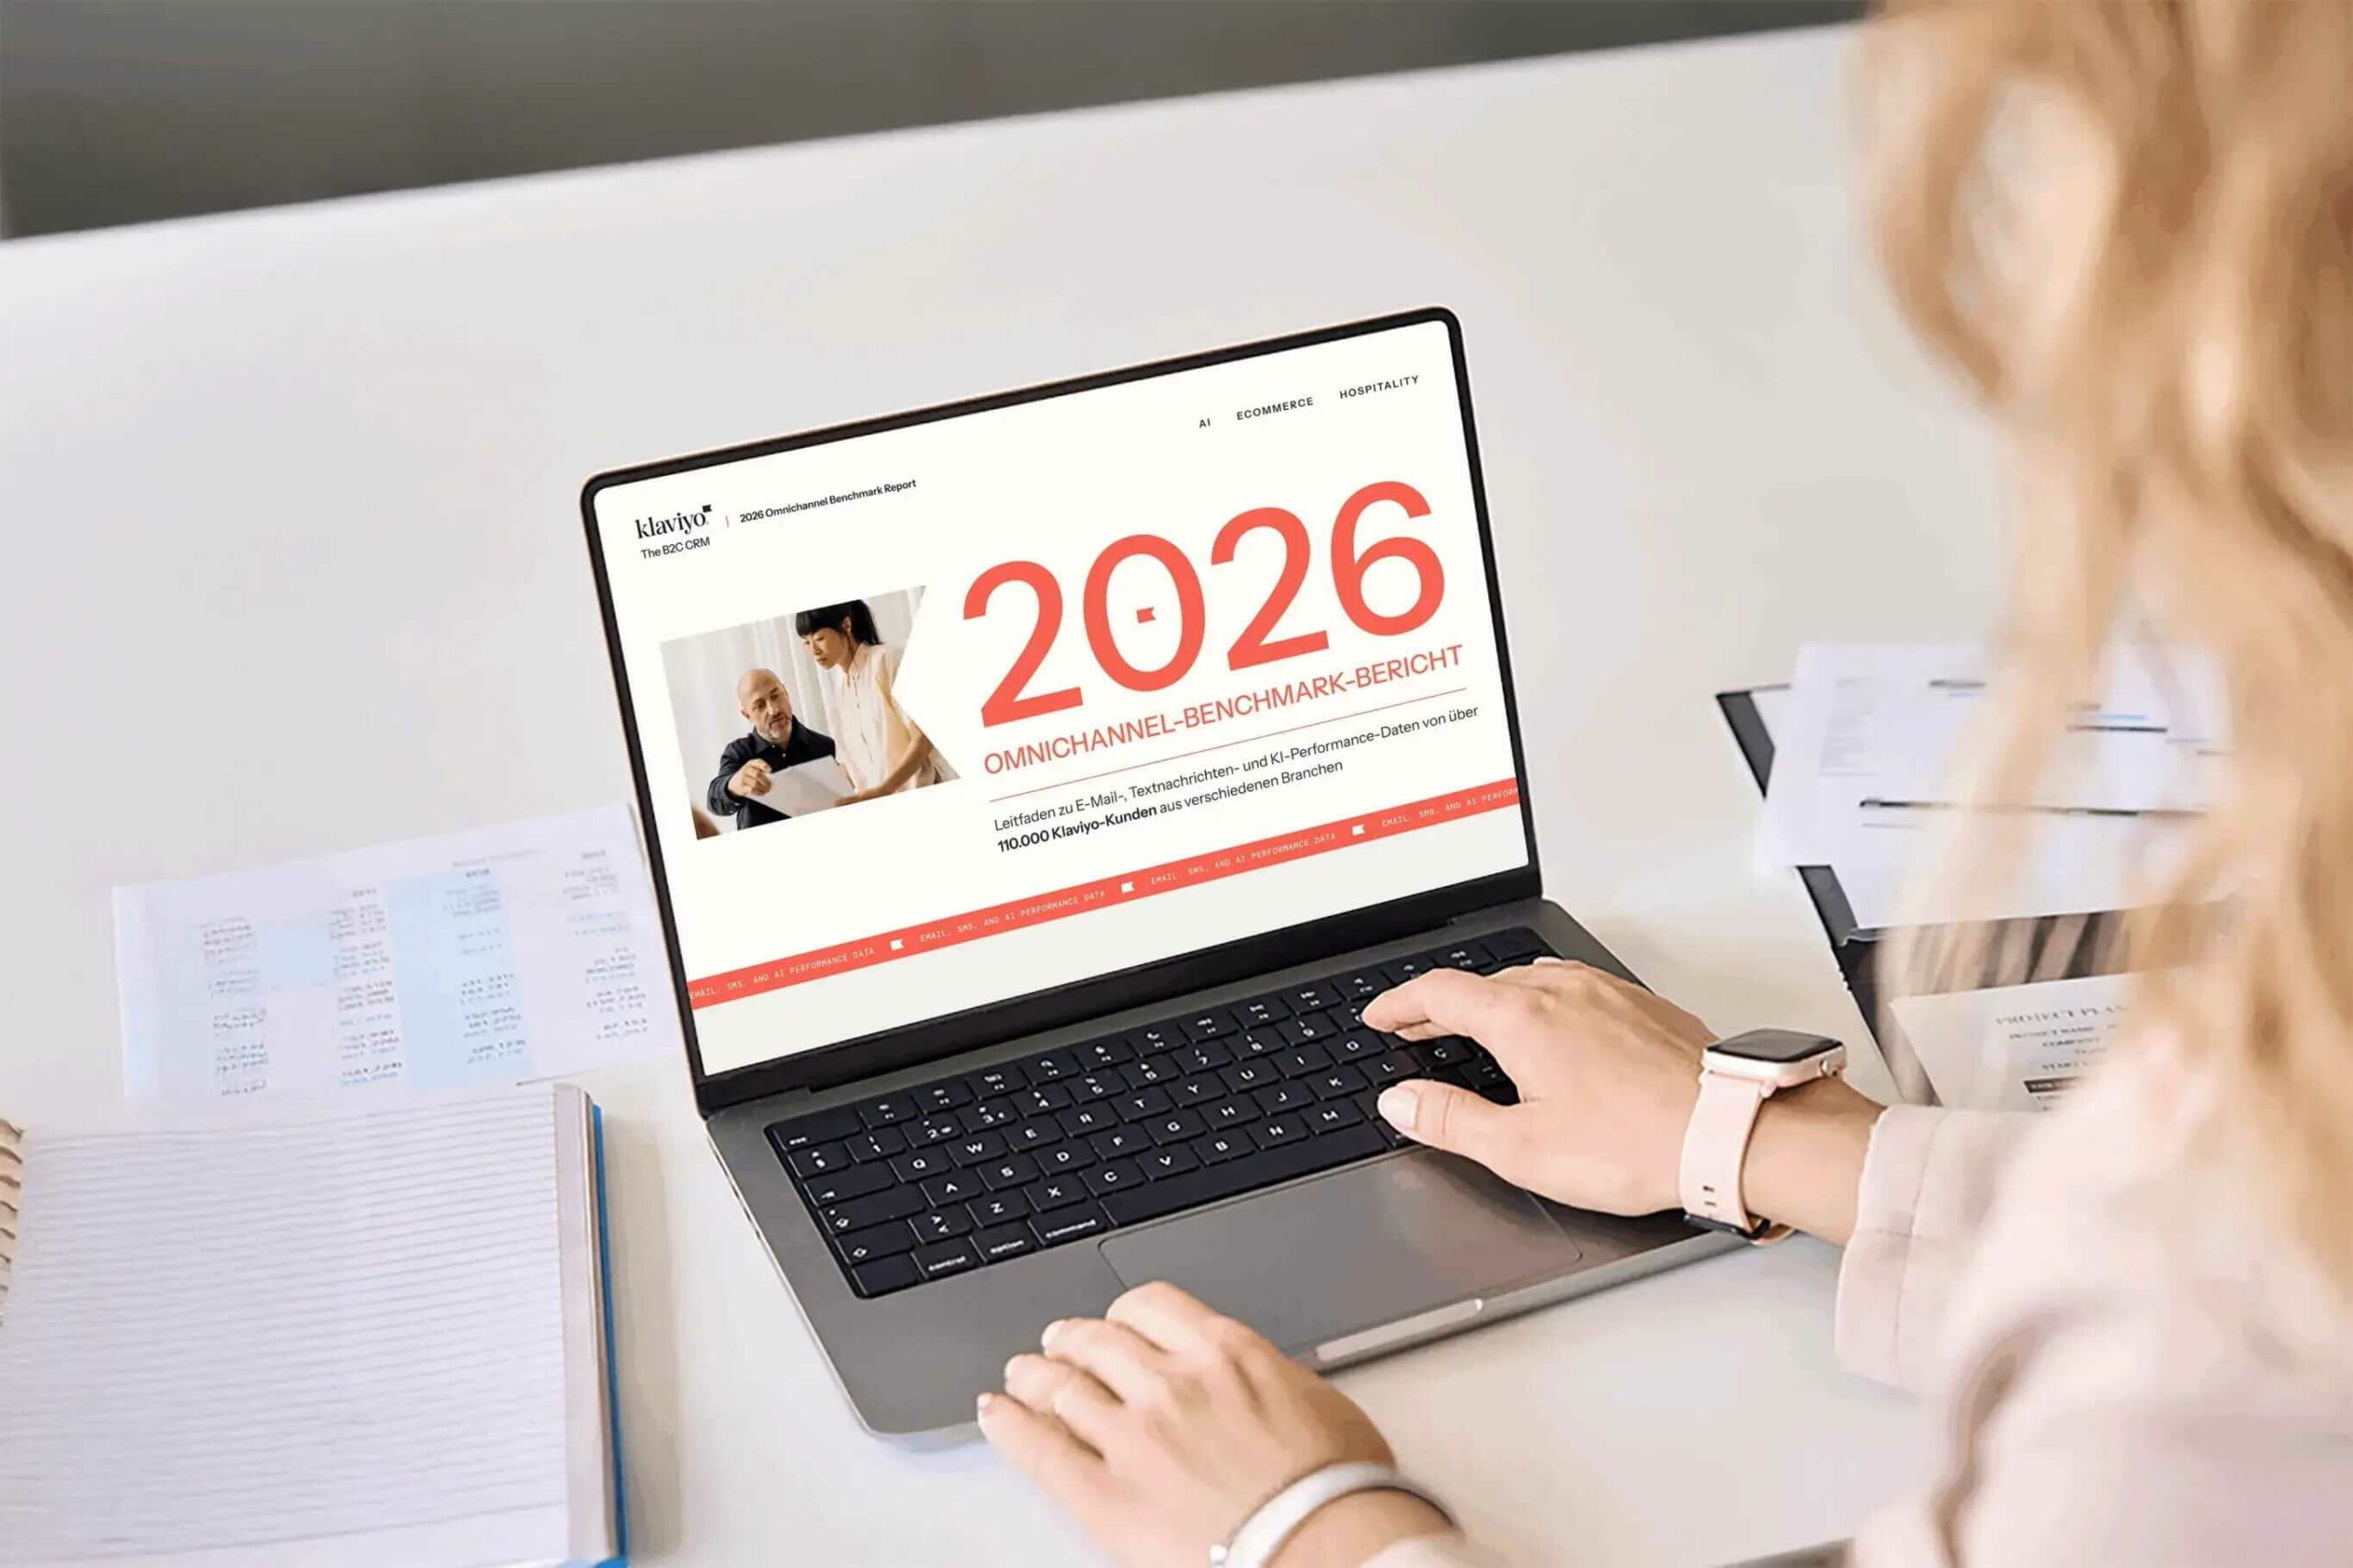
To help European brands navigate these exact questions, a massive data analysis of over 183,000 global brands was conducted to establish definitive e-commerce benchmarks.
Use these email marketing benchmarks as your tactical compass to understand where your store is outperforming the market, where there’s room to grow, and where small adjustments can make a major bottom-line difference.
| Looking for the complete data breakdown? Download Klaviyo’s full E-commerce Benchmark Report here to unlock comprehensive insights for your industry. |
Campaign vs. Automation: The Core Performance Indicators
The data yields an unmistakable reality for e-commerce operators: automated, behavior-triggered email flows consistently outshine traditional, one-off broadcast campaigns. Because automated emails – like welcome sequences or abandoned cart recovery – are triggered by direct user intent, they capture shoppers at their peak moment of interest.
1. Email Open Rate Benchmarks
Getting a subscriber to open your email is the first and most critical hurdle. If the email remains unopened, your promotional discounts, product updates, and storytelling never get a chance to convert.
Across the board, traditional email campaigns maintain an average open rate hovering between 28% and 33% depending on the industry vertical. For example:
- Clothing & Accessories: 33.1%
- Home & Garden: 32.5%
- Food & Beverage: 31.2%
- Health & Beauty: 30.5%
- Electronics: 29.3%
Actionable Strategy: To optimize your open rates, aggressively A/B test your subject lines and preview text. Focus on mobile responsiveness, brevity, and introducing localized personalization tailored directly to your European target demographic.
2. Email Click Rate Benchmarks
Click rates measure deeper engagement, proving that your inner email content, layout, and offers resonated well enough to drive traffic back to your online shop.
The divide between campaigns and automated flows here is striking:
- Campaign Click Rate: The average campaign click rate across all B2C industries sits at 1.69%, with top-tier brands (the highest 10%) reaching up to 3.38%.
- Automated Flow Click Rate: Triggered lifecycle automations yield a massive average click rate of 5.58%, while the top 10% of performers surpass 10.48%.
Industry-Specific Flow Click Rates:
- Toys & Hobbies: 5.96%
- Home & Garden: 5.96%
- Food & Beverage: 5.80%
- Clothing & Accessories: 5.54%
- Health & Beauty: 4.80%
Actionable Strategy: Reduce cognitive load within your emails. Limit competing calls-to-action (CTAs), keep the core offer clear, and use responsive, grid-based layouts to ensure clean mobile navigation.
3. Placed Order Rate (Conversion) Benchmarks
Ultimately, revenue is the metric that defines e-commerce success. Placed order rates clearly illustrate how effectively your email marketing acts as a direct sales driver.
- Campaign Conversion Rate: Across all verticals, one-off campaigns see a modest average conversion rate of 0.16% (with top performers hitting 0.36%).
- Automated Flow Conversion Rate: Behavior-based flows deliver a massive 2.11% average conversion rate, soaring up to 4.30% for top-performing brands. This represents a 13x increase in efficiency over manual broadcasts.
Industry-Specific Flow Conversion Rates:
- Food & Beverage: 2.46%
- Office Supplies: 2.18%
- Clothing & Accessories: 2.15%
- Health & Beauty: 1.96%
- Electronics: 1.95%
Key Takeaways for European E-Commerce Sellers
These findings point to several clear takeaways:
- Prioritize the Automation Engine: Triggered flows deliver 3x higher click rates and 13x higher conversion rates than standard newsletter campaigns. In fact, macro trends show that automated email structures can generate over 40% of an online store’s total email revenue from a mere fraction (around 5%) of total send volumes.
- The “Top 10%” Standard: High-performing e-commerce companies regularly achieve double the average baseline metrics. If your stats are currently sitting at the industry average, scaling up segmentation and flow sophistication represents an immediate revenue opportunity.
- Vertical Variance is Marginal: While open and click metrics fluctuate slightly between specific sectors (like apparel versus electronics), the baseline rules of engagement remain virtually uniform across the board.
Elevate Your E-Commerce Performance
To stay ahead in a highly competitive European marketplace, e-commerce brands must continuously cross-reference internal metrics with broader market data. Knowing where you stand allows you to move away from guesswork and lean into hyper-personalized, high-converting customer journeys.
| Ready to audit your store’s marketing metrics against the industry’s best? Get your copy of Klaviyo’s Benchmark Report today to view deep-dive breakdowns across welcome series, abandoned carts, and omnichannel SMS performance. |