Key Takeaways about the State of the eCommerce Industry [Influencer Marketing Hub Report 2022]

Many people turned to eCommerce because of the pandemic and its lockdowns. Nowadays, digital devices make ordering groceries and virtually anything else possible, even for computer-illiterate Baby Boomers. So what is the current state of the eCommerce industry? Study this topic with us or read the full report here.
The top 16 insights about the state of eCommerce
#1 eCommerce Average Order Value
In the EMEA countries (Europe, the Middle East, and Africa), the average order value increased 49% between Q2 2020 and Q2 2021, from $103.91 to $155.09. The US saw a 37% rise in order value from $114.05 to $156.30.
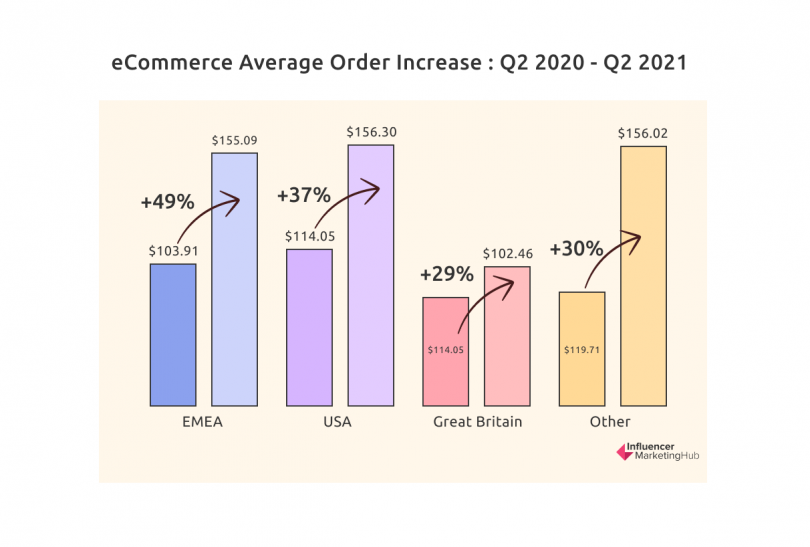
Source: eCommerce Benchmark Report 2022 – State of the eCommerce Industry
Direct, Email, Search, and Social are the four main channels that bring traffic to eCommerce stores. The average order value increased across all channels from Q2 2020 to Q2 2021, with Direct and Search showing the greatest growth.
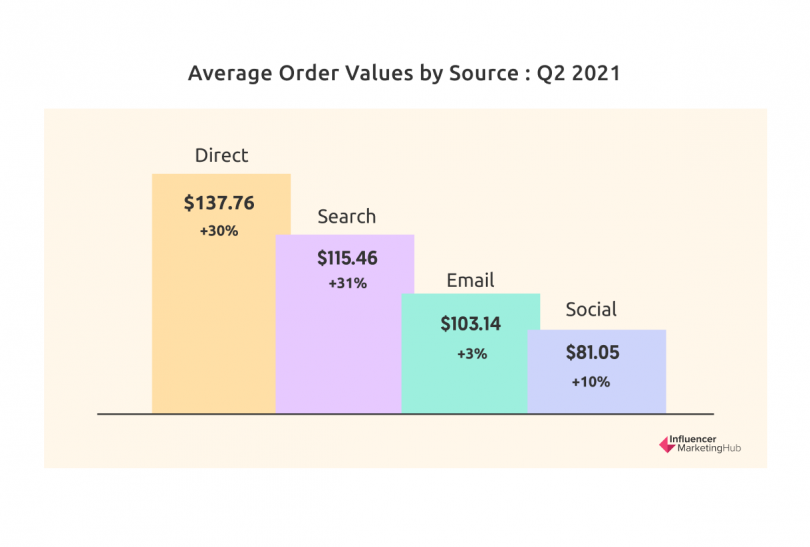
Source: eCommerce Benchmark Report 2022 – State of the eCommerce Industry
#2 Transaction Path Length
The average number of sessions per purchaser was 4.79, compared to just 1.7 per average user. For online-only stores, it increased to 5.21, while for retailers, it increased to 5.71, and for multi-channel sites, it increased to 5.94. Furthermore, online shoppers use a variety of areas during the purchasing process. For example, they use retailer eCommerce stores, traditional search engines, and social media platforms.
Online touchpoints are the primary influence on most online purchasers. Nevertheless, nearly one-third say offline touchpoints helped them make their purchase decision.
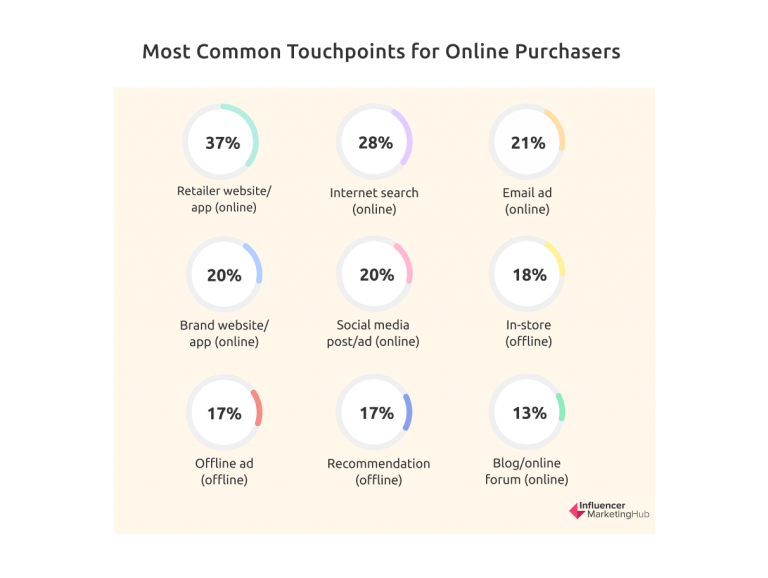
Source: eCommerce Benchmark Report 2022 – State of the eCommerce Industry
#3 eCommerce Traffic Source
A large percentage of eCommerce traffic comes from organic and paid searches. Their website traffic is generated by 33% organic search, 32% paid search, 12% direct, 9% email, 8% social, 2% display ads, 3% referrals, and 2% other sources.
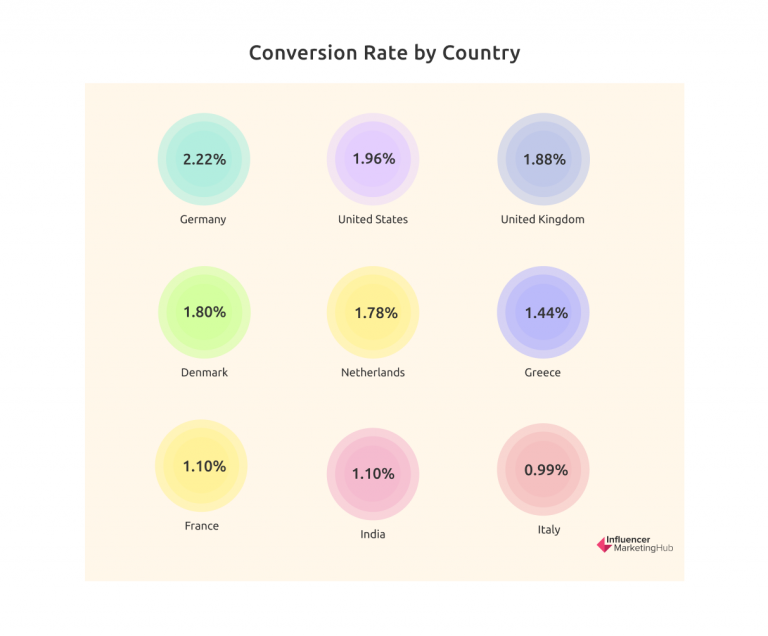
#4 eCommerce Conversation Rates
When it comes to eCommerce conversion rates, the following insights have been revealed:
- The conversion rate in Great Britain is double that of EMEA countries
- Among the main traffic sources, search has the highest conversion rate
- Private label business models have the highest conversion rates
- Also, the highest eCommerce conversion rate is found in Arts & Crafts
- The country where the eCommerce conversion rate is the highest in Germany
Source: eCommerce Benchmark Report 2022 – State of the eCommerce Industry
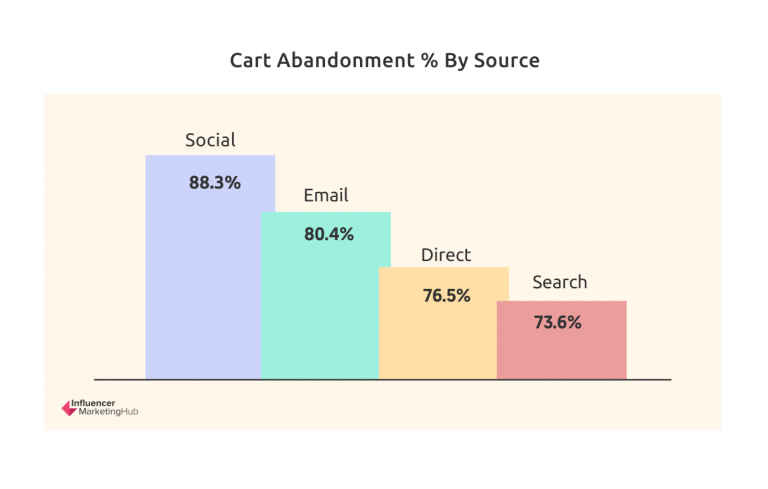
#5 Cart Abandonment Rate
Depending on location, cart abandonment rates vary from high to steady to falling. As of Q2 2021, the regions they call Other had the highest abandoned cart rate (82.1%), a decrease of 3% from Q2 2020. This was followed by EMEA, USA, and GB. Between Q2 2020 and Q2 2021, abandoned cart rates declined in all traffic sources.
Source: eCommerce Benchmark Report 2022 – State of the eCommerce Industry
In addition, mobile phone users abandon their carts more frequently than desktop or tablet users.
#6 Google Ads and Google Shopping
Google is also worth mentioning when it comes to the state of the eCommerce industry. Especially worth mentioning are Google Ads and Google Shopping.
Across all industries, Google Ads has an average click-through rate (CTR) of 3.17% on the Search network and 0.46% on the Display network. In addition, Dating & Personals is vertical with the highest CTR on the Search network.

Source: eCommerce Benchmark Report 2022 – State of the eCommerce Industry
Additionally, the average CTR for Google Ads (Search) is 3.17%, CPC is $2.69, and ACR is 3.75%.
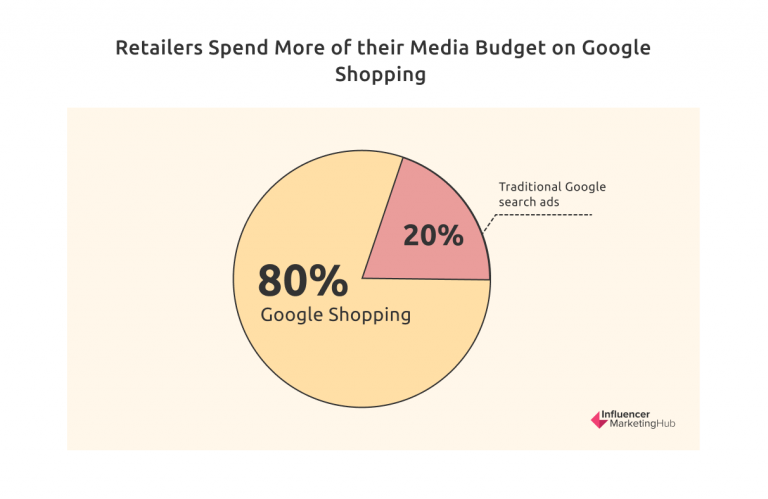
Brands spend considerably more on Google Shopping than other types of Google Ads. Therefore, they now allocate 80% of their Google media budget to Google Shopping and only 20% to more traditional Google search ads.
Source: eCommerce Benchmark Report 2022 – State of the eCommerce Industry
What’s more, the average CTR for Google Shopping across all industries is 0.86%, CPC is $0.66, and ACR is 1.91%.
#7 Annual eCommerce Growth Rate
Retail eCommerce sales in 2014 reached $1,336 billion. In 2020, Covid’s first year, this increased 27.6% to $4,280 billion, up 27.6% since then. There is expected to be an increase of 10.9% in 2022, 8.9% in 2023, and 8.1% in 2024.

Source: eCommerce Benchmark Report 2022 – State of the eCommerce Industry
#8 Customer Retention by Vertical
Metrilo’s research found that, on average, 28% of customers place more than one order with a particular shop, based on a sample of 65 businesses. (Legal) CBD has the highest retention rate of all sectors, at 36.2%. Next are Sports Clothing (33.0%), Pet Stuff (31.5%), and Coffee (29.6%).

Source: eCommerce Benchmark Report 2022 – State of the eCommerce Industry
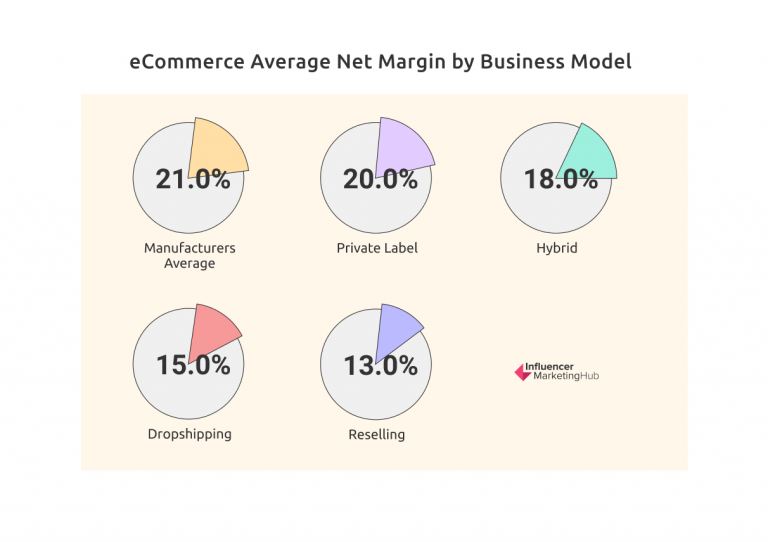
#9 eCommerce Margins by Business Model
While eCommerce businesses have an average gross margin of 45%, this can vary considerably depending on your business model. In addition, Manufacturers average a 21% net margin, followed by Private Label (20%), Hybrid (18%), Dropshipping (15%), and Reselling (13%).
Source: eCommerce Benchmark Report 2022 – State of the eCommerce Industry
#10 Average Page Views Per Consumer
Between 2020 and 2021, the average number of page views worldwide decreased. The average number of page views in Great Britain dropped 18%, from 11.7 in Q2 2020 to 9.6 in Q2 2021. In the USA, the decline was less pronounced (14%)
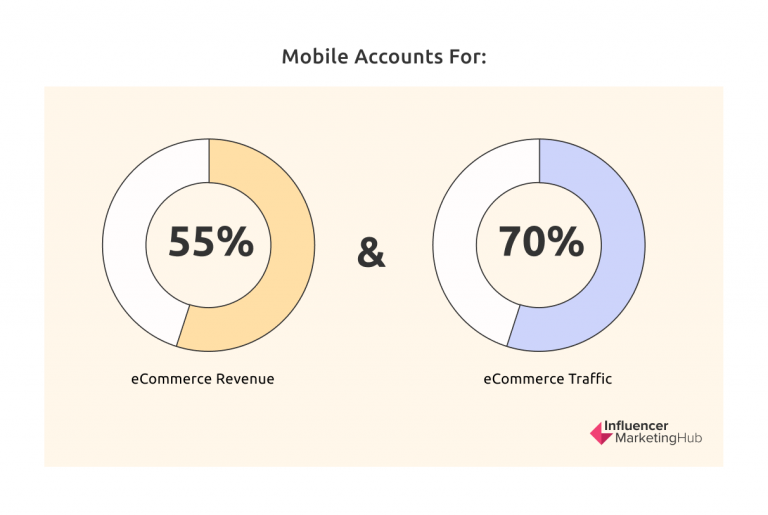
#11 Mobile vs. Desktop Purchases
The number of people purchasing on their mobile phones has increased – mobile now accounts for 55% of eCommerce revenue and 70% of traffic. With tablets contributing 9% of revenue and 8% of traffic, desktop computers contribute 36% of revenue and 22% of traffic.
Source: eCommerce Benchmark Report 2022 – State of the eCommerce Industry
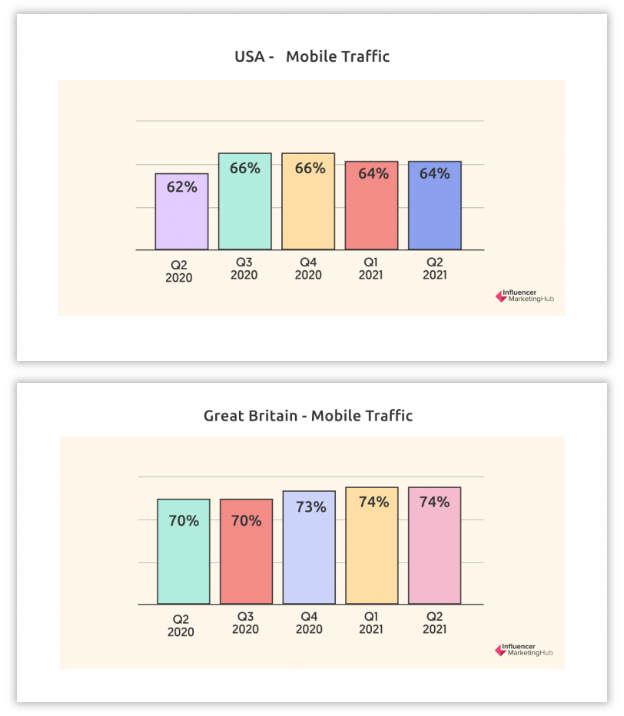
What’s more, mobile has flattened in the USA but continued to rise in Great Britain.
Source: eCommerce Benchmark Report 2022 – State of the eCommerce Industry
#12 Consumers Who Research Online and Then Purchase In-Store
The people who conducted online research generated an additional 168% revenue in “in-store” transactions over and above their online sales, along with an additional 84% conversion rate. Also, the Average Order Value of research-online-purchase-in-store sales is 199% higher than that of online-only retailers.
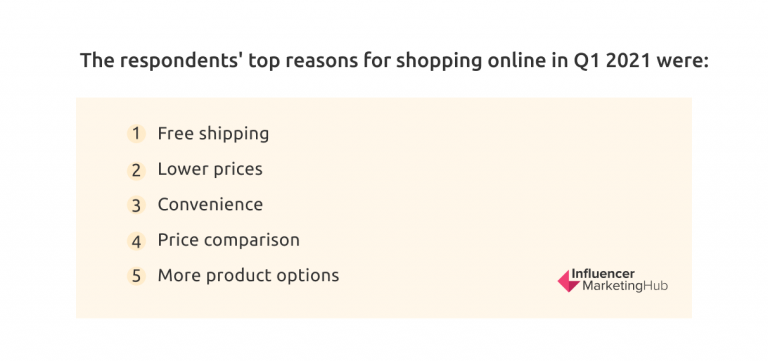
#13 What Consumers Most Value from Online Retailers?
Consumers prefer shopping online because of free shipping.
Source: eCommerce Benchmark Report 2022 – State of the eCommerce Industry
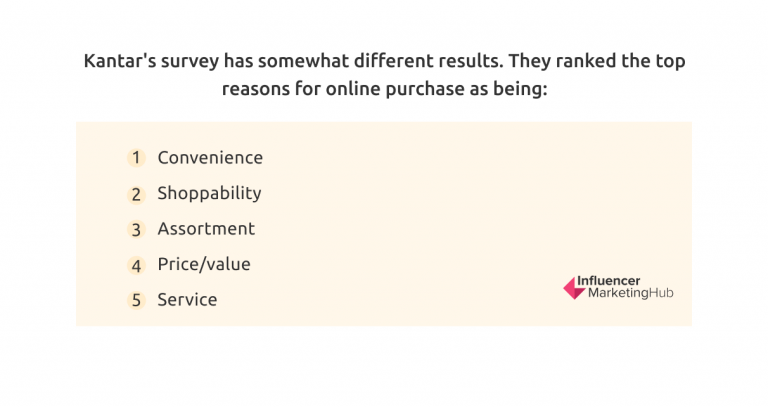
On the other hand, the survey from Kantar showed that online retailers most value convenience.
Source: eCommerce Benchmark Report 2022 – State of the eCommerce Industry
#14 Impact of Covid 19 on eCommerce
Many businesses suffered because of the pandemic, but some industries gained a lot, like eCommerce. Every product can now be ordered online, including some unimaginable a year or two ago.
As a percentage of total US retail sales, eCommerce accounted for 4.2% in Q1 2010. The rate gradually increased each quarter, reaching 11.4% in Q1 2020. In Q2 2020, eCommerce’s share jumped to 15.7% due to the onset of Covid.
As a result of Covid 19, many small local businesses had to establish an online presence to survive quickly. Therefore, many local retailers, shops, and restaurants have shifted part of their business online in response to an urgent need.
#15 Trends for 2022
First of all, the travel and High-Tech / B2B sectors will expect significant growth. Also, voice search will continue to gain in popularity. Therefore, Kantar asked its respondents why they use voice devices. Among the reasons for the decision were:
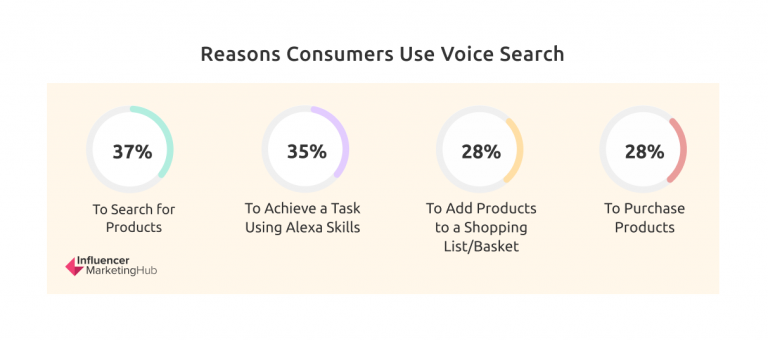
Source: eCommerce Benchmark Report 2022 – State of the eCommerce Industry
We will also see increased use of augmented reality to visualize purchases. What’s more, online purchasers intend to make greater use of “Last Mile” delivery services.
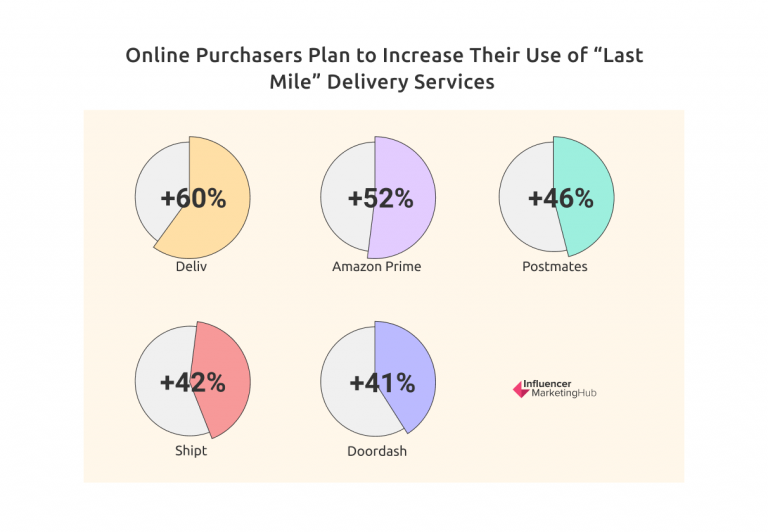
Source: eCommerce Benchmark Report 2022 – State of the eCommerce Industry
#16 eCommerce Opportunities
The largest opportunity for partnering with eCommerce retailers is performance tracking, measurement, reporting, and analytics. Among the other opportunities considered noteworthy were:

Source: eCommerce Benchmark Report 2022 – State of the eCommerce Industry
Additionally, 40% of industry professionals believe improving the user experience is the biggest opportunity for eCommerce marketing in the next five years. Other potential eCommerce opportunities for industry professionals include:
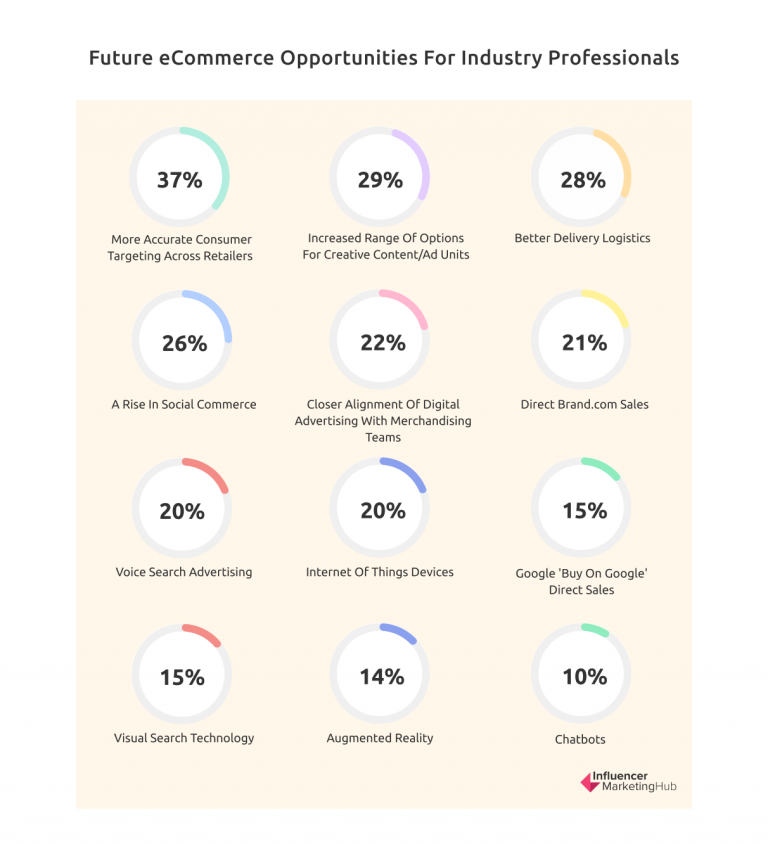
Source: eCommerce Benchmark Report 2022 – State of the eCommerce Industry
To sum up
Covid has triggered many unexpected changes. As a result, eCommerce has met with a sudden surge of interest. That’s why it’s not surprising many want to see how this industry is changing, what trends await it, and what opportunities lie ahead.
We hope this article has answered many of your questions, and you will take advantage of the power of eCommerce!