Seasonality in eCommerce: Analyzing quarterly revenue patterns
Ever wondered why online shopping peaks dramatically at certain times of the year? ECDB insights dive into eCommerce seasonality, uncovering surprising trends—like why gifts and gadgets dominate year-end spending and flowers bloom online sales in early spring. (Ad)

Commercial collaboration
By Nadine Koutsou-Wehling, Data Journalist
Retail sales follow seasonal patterns, and this is all the more valid in eCommerce. Summertime is just beginning, which is why we at ECDB examined our extensive data pool to identify sales rhythms of product categories throughout the year.
Taking the German eCommerce market as an example, the quarterly revenue patterns provide two immediate conclusions: The weather has a deep impact on consumption patterns, and the fourth quarter is by far the champion of eCommerce seasons.
The fourth quarter accounts for a majority of revenues
Across the board, and this includes the categories that are otherwise strong in the first half of the year or in the middle of the year, the fourth quarter is the highest revenue generator for every category.
That is because of two aspects: The holiday and end-of-year season when giving gifts is common, and the occurrence of major eCommerce shopping days. These include Black Friday and Cyber Week, Singles’ Day, as well as, of course, Prime Day.
The only exception is Garden products, where the first quarter accounts for 27.2% of yearly sales, compared to 27.6% in the second quarter. As you can see, the fourth quarter is still significant, despite being bested by Q2. This is the case for special occasion products and everyday necessities alike, which consumers like to stock up on when products are heavily discounted.
Speaking of the outdoor product categories like Garden products. What other categories do have solid performance in the first half of the year? What factors can one identify?
Anticipating summer: Dressing up and fixing up
Ordering the stacked columns by the first quarter size yields Flowers & Gifts as the number one eCommerce category for the months January to March. Together with the second quarter, the first half year accounts for 49.7% of annual revenues in Flowers & Gifts. Two events significantly contribute to this: Valentine’s Day and Mother’s Day.
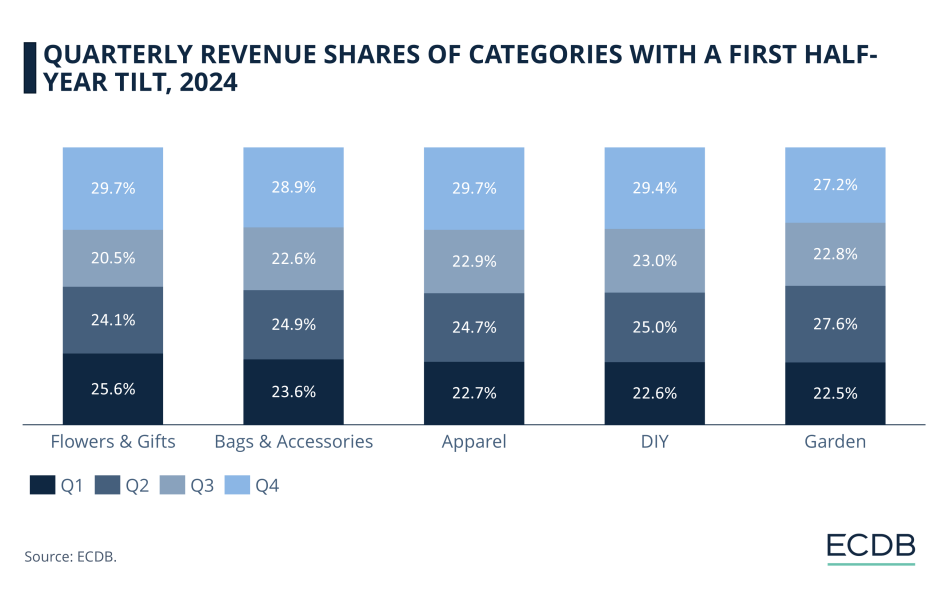
Following this first category are two subcategories of Fashion products: Bags & Accessories, as well as Apparel. Both are leading categories in the first annual quarter, but sell even better in the second quarter. From April to June, when summertime approaches, consumers like to shop for clothing and accessories that help them look forward to the coming months.
Garden and DIY products perform similarly with a 22.5% share in the first quarter, but are also especially sought-after in Q2 – again, increasing temperatures and longer hours spent outside play a substantial role for their growing demand around this time. Do-it-yourself activities and gardening are popular pastimes that gain traction in the spring.
Indoors entertainment and giving gifts at the end of year
In contrast to the fair-weather categories, consider those where consumers are looking for in-home entertainment. Product categories that lean toward second-half year consumption thrive unanimously in Q4: Toys account for 32.7% of yearly revenues in the months October to December, and it figures. Which child does not want to receive a toy for the holidays?
But children aren’t the only ones who are happy to receive a gift during this time of year. Older consumers are excited about Consumer Electronics, Media, and Electrical Appliances. This is why all of these categories have revenue shares of around 33% in Q4. Apart from their suitability as presents, Electronics provide good entertainment when outdoor activities are hindered by cold temperatures and rain or snow.
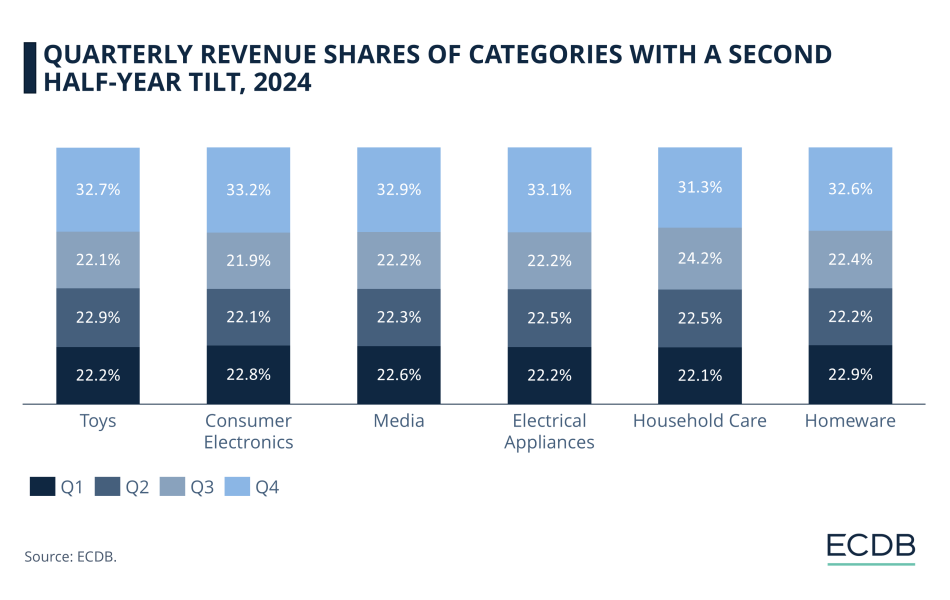
Apart from entertainment purposes, there are other indoor activities the products of which receive an upswing at the end of the year: Cleaning and decorating.
Household Care has higher shares in Q3 than the other categories, where usually eCommerce revenues are lowest. July through September are typical vacation months, when people spend less time indoors than in the winter. This is why it is uncommon to buy many things online, especially considering the impending shopping season.
Categories more detached from yearly fluctuations
Despite its lower importance for eCommerce compared to the remaining months, Q3 is not entirely insignificant. Particularly when combined with the second quarter, which makes up the middle of the year, some categories emerge as valuable midyear products.
Notably, these categories remain fairly consistent throughout the year: Bullion & Precious Metal, Pet Supplies, Tools & Construction and Vehicle Parts. Their independence from weather conditions and year-round necessity certainly plays a part in this.
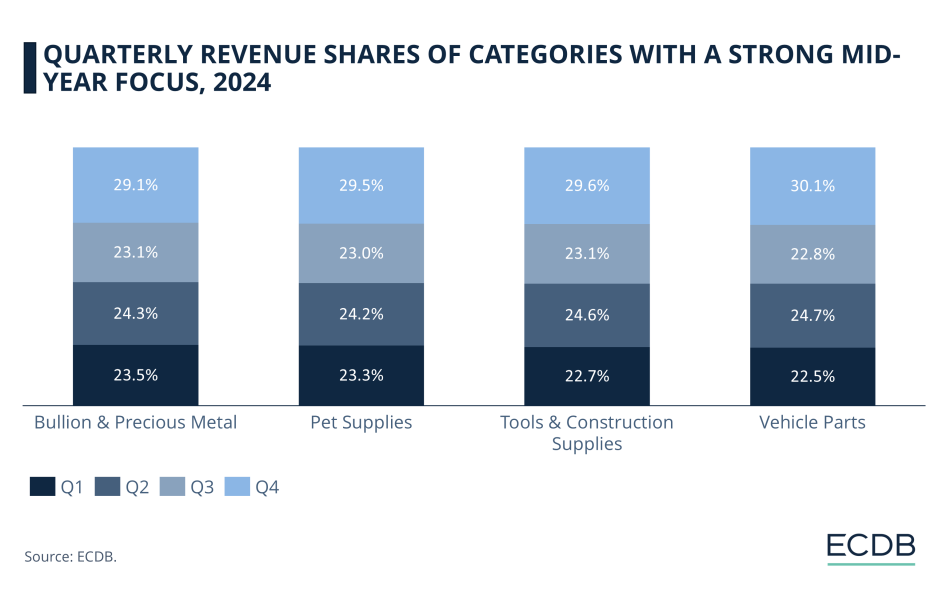
Pet Supplies are needed year-round, and some consumers prefer online channels for pet products due to wider selections and convenient delivery. Consumers can most easily compare precious metal prices online, and, due to price fluctuations, the end-of-year shopping frenzy does not impact these categories as much as it does the ones that are less prone to fluctuating prices, such as Electronics.
The same goes for Vehicle Parts and Tools & Construction, which aren’t particularly weather-related, even though it’s safe to assume users take advantage of the end-of-year sales in these categories as well.
Closing thought
Although the fourth quarter tends to be strongest across the board, some categories closely follow seasonal peaks driven by holidays or weather and others maintain steadier performance across the year due to constant demand or less season-dependent usage.
The German market example given here can be used as a blueprint for other markets in a similar climate condition. But it will change in a market depiction from the Southern Hemisphere or where other holidays and shopping incentives occur.
It shows how deeply connected eCommerce revenue patterns are with consumer choices and population preferences for pastimes throughout the year.
***