Amazon PPC masterclass optimisation guide 2025
Master Amazon PPC with this comprehensive 2025 optimisation guide. Learn expert strategies to boost campaign performance and reduce wasted ad spend. (Ad)

(Image Source: www.unsplash.com)
Commercial collaboration
This guide presents 10 measures for analysing and optimising your Amazon PPC campaigns. The approaches outlined are based on the analyses that an experienced Amazon Agency would carry out for their clients on a daily basis. Thanks to these measures, those clients have achieved a cumulative annual turnover of over 100 million euros on Amazon in the past year.
The objective of this guide is to provide you with practical tools that will make your everyday life as a seller on Amazon easier and enable you to optimise your campaigns even more efficiently. In addition to the description of each measure, you will find an explanatory video which shows you, among other things, the analysis options within the advertising console.
Optimisation guide overview:
- Determination of advertising expenditure and advertising sales by campaign type and campaign focus
- Analysis of advertising expenditure and advertising sales by product (incl. TACoS calculation at parent SKU level)
- Identification of advertising expenditure without orders and with negative ROAS (Wasted Ad Spend)
- Evaluation of current keywords and product placements and identification of additional unused advertising placements
- Determination of advertising expenditure and advertising revenue by traffic source
- Analysis of the existing campaign structure and development of an optimised, more detailed campaign structure
- Evaluation of the currently used bid adjustments
- Analysis of the current market share in your product category
- Evaluation of the relevance of the top ad placements in your product category
- Introduction to the single ASIN and single keyword campaign strategy
1. Determination of advertising expenditure & advertising sales by campaign type and campaign targeting
When determining advertising expenditure and advertising sales by campaign type and campaign focus, obtaining an overview is the first step. To do this, it is necessary to take a concrete look at what proportion of advertising costs is currently invested in which campaign type and what advertising revenue is generated with each campaign type.
Campaign types analysed:
- Sponsored Product Campaigns
- Sponsored Brand Campaigns (incl. video campaigns)
- Sponsored Display Campaigns (incl. video campaigns)
The following breakdown shows a particularly efficient utilisation of the advertising budget:
- Sponsored Product Campaigns: approx. 70-80% of advertising costs
- Sponsored Brand Campaigns: approx. 10-20% of advertising costs
- Sponsored Display Campaigns: approx. 5-15% of advertising costs
Once the distribution by campaign type has been determined, distribution by campaign orientation is also examined.
The focus is placed on differentiating between automatic & manual campaigns as well as between keyword targeting and product placement targeting campaigns (interests & target groups are neglected for simplicity).
A general guideline for the distribution of advertising expenditure according to focus is as follows: the clearer the search intention of the consumer, the lower the proportion of automatic advertising campaigns should be.
An experienced Amazon Agency would adhere to the following advertising budget distribution in their everyday work:
Manual SP campaigns receive around 80 % of the advertising budget, while automatic SP campaigns are allocated around 20 %.
There is currently no set rule for the distribution of the advertising budget between keyword campaigns and product targeting campaigns. However, in most of the sellers’ advertising accounts, keyword campaigns account for around 50-70% of the budget, while product targeting campaigns receive around 20-35%. The remaining advertising budget is divided between automatic campaigns and/or target group campaigns.
2. Determination of advertising expenditure & advertising sales by product (incl. TACoS determination on parent SKU)
In this optimisation step, the two following points are especially important:
- Are all available products currently advertised?
- How are the advertising costs distributed in relation to the advertising sales of the advertised products (TACoS)?
2.1 Are all existing products currently being advertised?
In the advertising console you will find the menu item “Products”. If you click on this, you will be redirected to the overview with the tabs. Click on the tab “Promoted products” and then “All products sold”. In addition to the sales of the respective ASINs, the advertising status is also displayed here: Advertised (product is advertised) or Not advertised (product is not advertised). This gives you a quick overview of which products are sold but not yet advertised.

2.2 How are the advertising costs distributed in relation to the advertising sales of the advertised products (TACoS)?
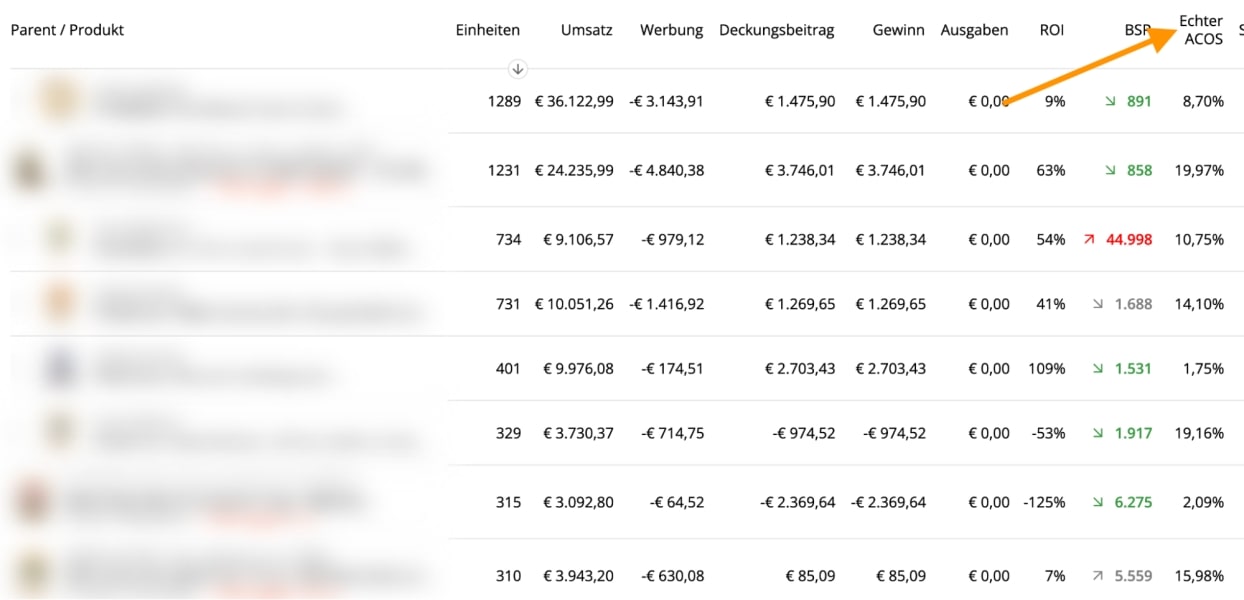
Of course, it is not enough to just know whether all products are being advertised; you also need to analyse the share of advertising costs in the total turnover of a product. You can use tools such as Sellerboard to do this.
Important: Most sellers make the mistake of looking at the ratio of advertising costs to total sales at ASIN level; you should avoid this with variation products. Always look at the advertising costs of an entire variation in relation to the total sales of a variation.
3. Identification of advertising expenditure without orders and with negative ROAS (Wasted Ad Spend)
A crucial optimisation step is the analysis of advertising spend that does not generate sales or has a negative return on advertising spend (ROAS). This so-called Wasted Ad Spend shows where budget is being used inefficiently and gives you the opportunity to take targeted countermeasures.
3.1 Why is analysing Wasted Ad Spend important?
By identifying inefficient advertising spend, you can:
- free up budget that can be utilised more profitably elsewhere.
- eliminate irrelevant keywords, placements or target groups.
- sustainably improve the overall performance of your campaigns.
3.2 How do you identify Wasted Ad Spend?
In the advertising console, you can filter specifically for campaigns, ad groups or keywords that do not generate any orders or have a negative ROAS. To do this, proceed as follows:
Filter your alignments: Go to the advertising console and go to the “Alignments” section.
Note: The data from the targeting view does not include targets from Sponsored Display or Sponsored Brands campaigns.
Filter your orientations according to the following criteria:
- Set date field to last 30 or 60 days
- Active target status: Activated
- Active status of the campaign: Activated
- Amortisation of advertising expenditure ROAS: less than 1
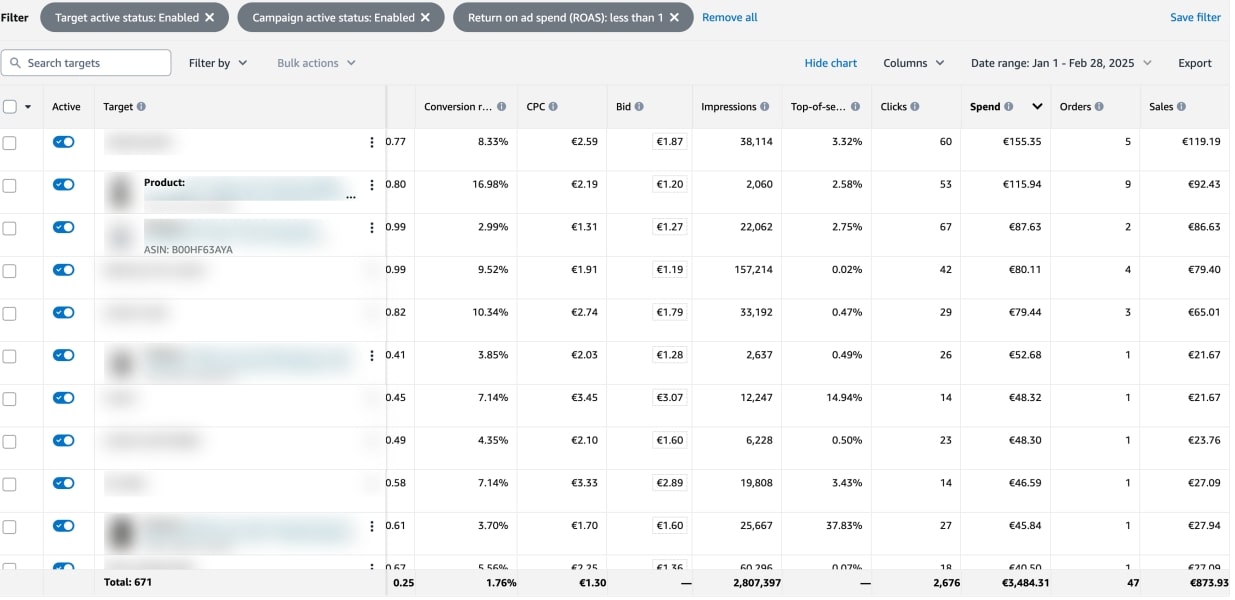
In this screenshot you can see that in the period from 1st of January 2024 to 28th February 2025, the advertiser spent a total of €3,484 on campaigns with a ROAS below 1, resulting in a revenue of only €873€ (based on SP campaigns and active campaigns only).
In the next step, you can go even deeper and analyse how high the advertising expenditure was for campaigns that did not generate any orders in the selected period.
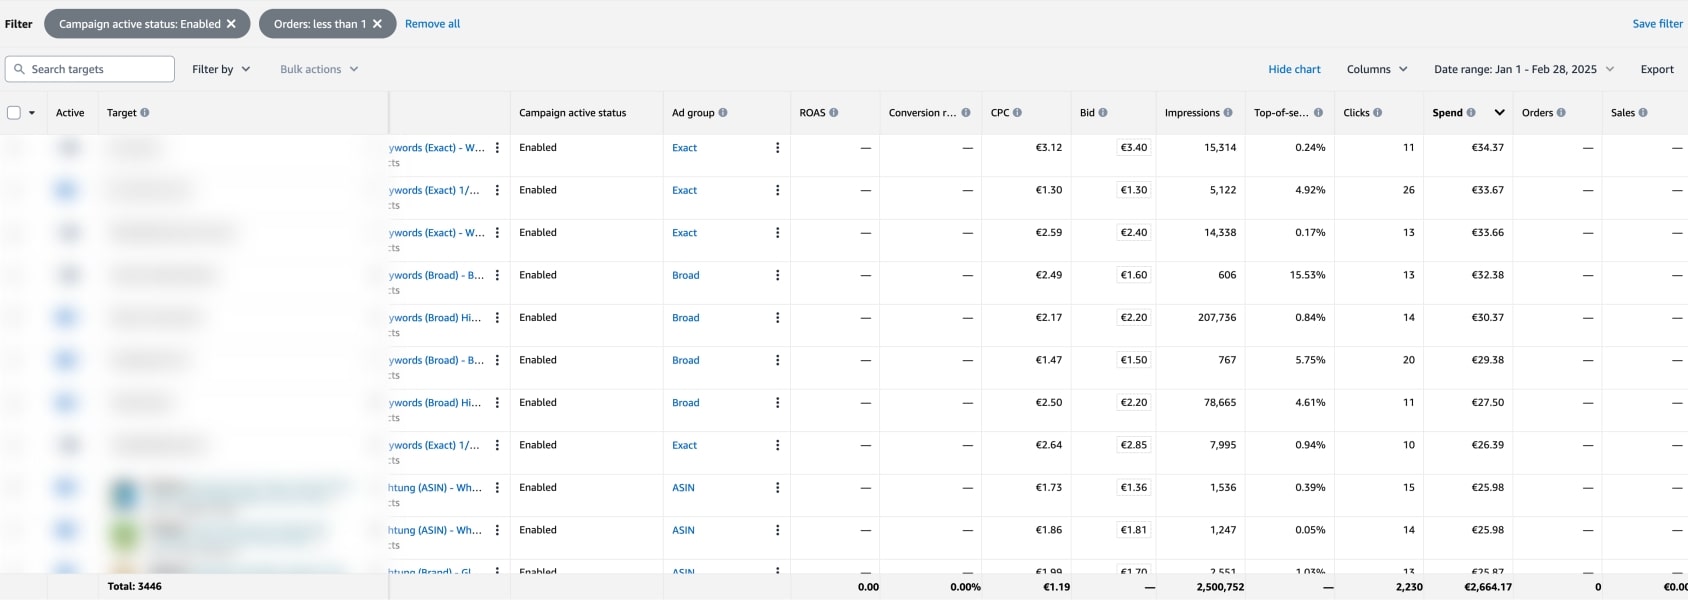
Depending on what your current objective is, the proportion of advertising costs with negative ROAS or no orders in the total advertising costs can vary.
An advertiser with a high growth target can certainly accept up to 20% of advertising costs with negative ROAS, while someone who is optimising for profitability should aim for a maximum target value of 5%.
However, values above 30% should always be an alarm signal and prompt you to take appropriate action.
4. Evaluation of current keywords and product placements and identification of additional unused advertising placements
Thoroughly analysing the keywords and product placements in your PPC campaigns is essential to ensure that you are not leaving any potential untapped. The aim is to identify relevant keywords that are either missing in your campaigns or are being used efficiently in your competitors’ campaigns.
4.1 Are all relevant keywords stored in the PPC campaigns?
The first step is to compare your stored PPC keywords with the organic keyword rankings of your products. To do this, proceed as follows:
- Compare organic rankings of your products with PPC keywords:
Use tools such as Helium 10 Cerebro to analyse the organic keyword rankings of your products and compare them with your stored PPC keywords. - Compare organic rankings of competitor products:
Check your competitors’ organic keywords and make sure that all relevant keywords they use are also included in your campaigns.
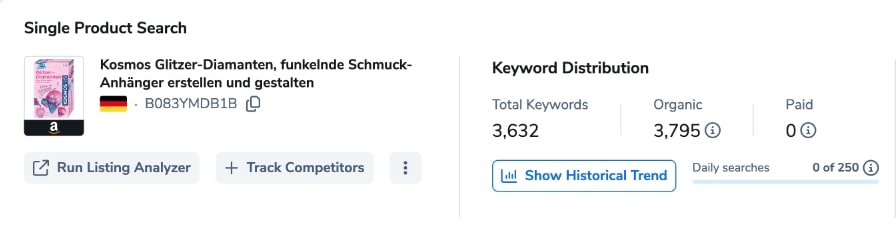
In the screenshot you can see the organic keyword rankings of the product “Kosmos Glitter Diamonds” with 3,795 specified keywords. At the same time, however, the product is not advertised, which can be recognised by the number of paid keywords.
Analyse both your organic keyword rankings and those of your competitors and check whether you are already using these keywords in your campaign setup.
Analyse both your organic keyword rankings and those of your competitors and check whether you are already using these keywords in your campaign setup.
4.2 How can you identify untapped potential?
A good balance between organic and paid keywords is crucial. Here are the most important approaches:
- Organic vs. paid keywords ratio: Ideally, at least should 10 % of the organic keywords also be represented in your PPC campaigns. particularly keywords with organic rankings You should include in your campaigns, as these are already performing strongly and can gain additional visibility through paid advertising.between 4 and 16
- Focus on competitor keywords: Analyse the organic and paid keywords of your competitors. Filter all keywords that a have and check whether these are missing in your setup.sponsored rank of 1 to 20
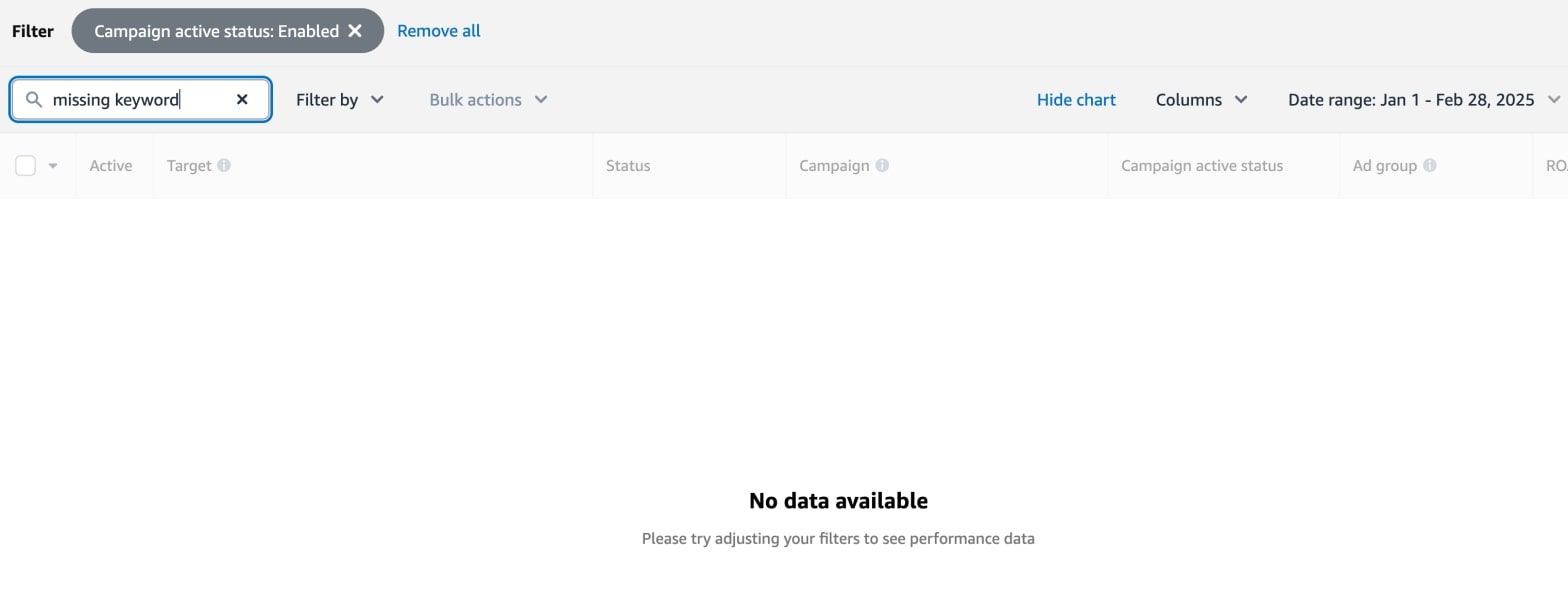
4.3 How do you know that keywords are missing in your setup?
To identify missing keywords in your setup, proceed as follows:
- Open the alignment tab in the advertising console.
- Enter the relevant keyword in the search field to check whether it is stored in your campaigns.
- Make a note of any keywords that are missing and add them to a new or existing campaign.
4.4 Conclusion
By specifically comparing your PPC keywords with the organic rankings of your products and competitors, you can ensure that no relevant placements remain unutilised. Regularly reviewing and supplementing these keywords will help you to increase your visibility and advertising efficiency.
5. Determination of advertising expenditure and advertising revenue by traffic source
An often underestimated aspect of campaign optimisation is the precise separation and analysis of advertising expenditure and sales by traffic source. This differentiation is essential in order to understand the influence of the various sources on advertising success and to be able to make well-founded optimisation decisions.
5.1 Why is it important to analyse traffic sources?
Many advertisers neglect to analyse which traffic sources make the biggest contribution to advertising revenue. It is crucial to systematically separate and analyse campaigns in order to obtain a clear picture. This is particularly important:
- Differentiation between own brand, generic keywords and external brands:
This separation makes it possible to clearly recognise the influence of private label searches on overall performance. - Understanding customer behaviour:
It becomes visible whether customers search for your brand specifically or come across your products via generic or third-party brand-related keywords.
5.2 This is how you proceed:
1. Separation of campaigns according to traffic sources:
- Own brand: Keywords and product placements that directly relate to your brand (e.g. brand name, specific product names).
- Generic keywords: Keywords that include general search terms (e.g. “black leather belt”).
- Third-party brands: Keywords or product placements that target competitor brands.
2. Creation of portfolios for a better overview:
- Divide your campaign portfolios into own brand and generic/foreign brand in order to be able to analyse the performance of both areas independently of each other.
- This portfolio breakdown makes it easier to evaluate the results at a higher level.
3. Evaluation of the results:
- Use tools such as the advertising console to analyse advertising expenditure and sales according to the defined sources.
- Check whether own-brand searches make up the majority of your sales, or whether generic and third-party brand searches contribute significantly.
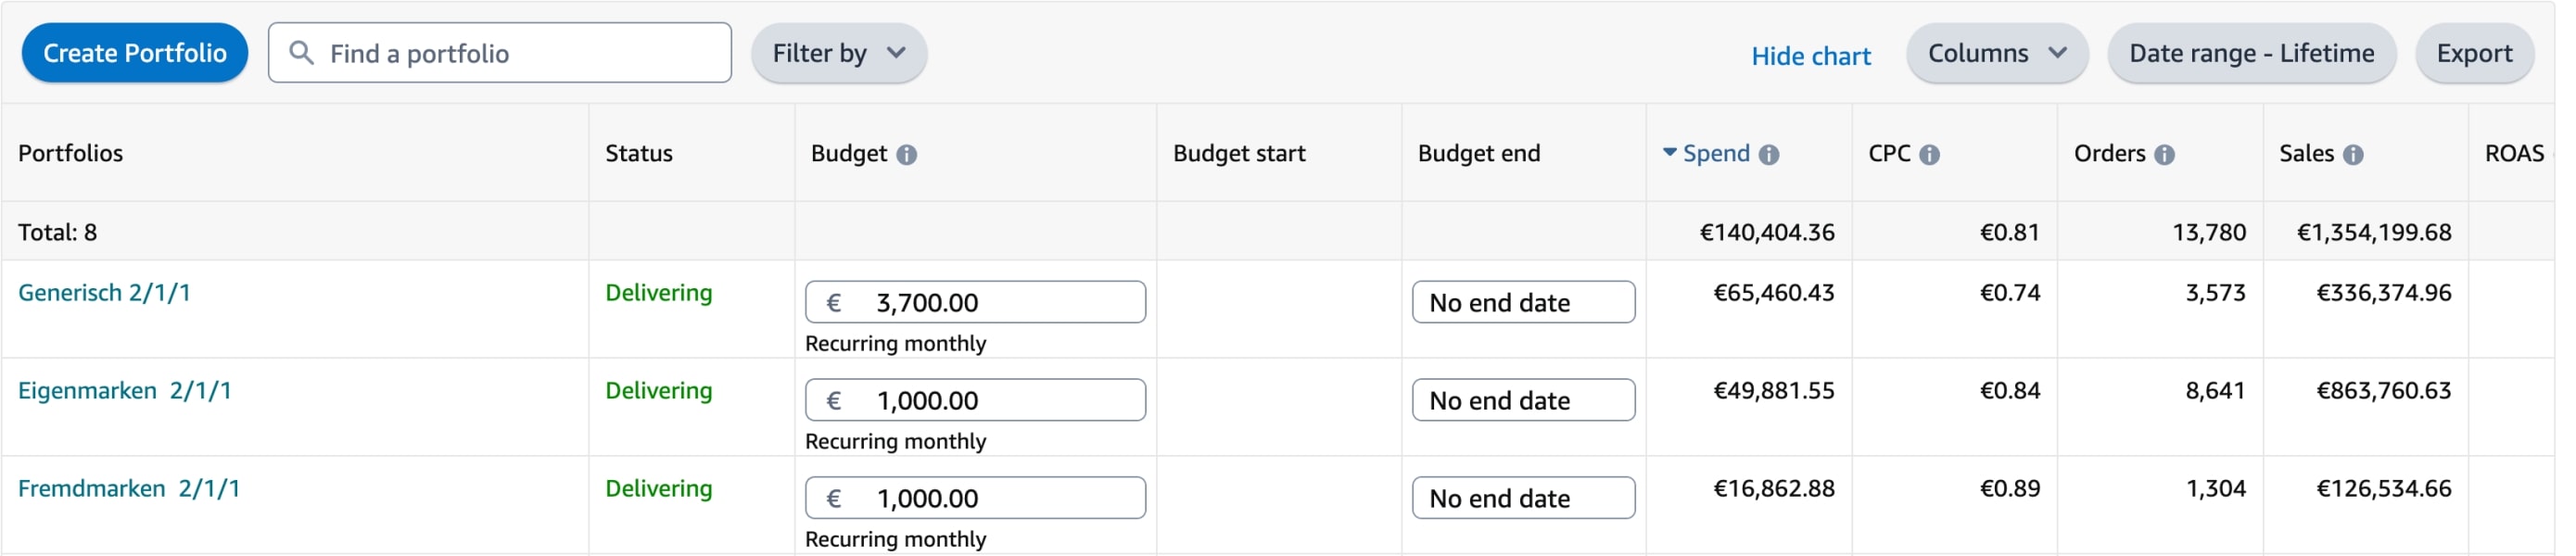
This screenshot shows how important branded advertising is for the advertising performance of the two advertisers. In the first screenshot, the advertiser generates over 50% of its advertising revenue from branded advertising.
Analysing advertising spend and sales by traffic source is a key component in increasing the efficiency of your campaigns. By separating them into own-brand, generic and external brand sources, you can understand exactly how customer behaviour affects your advertising success and derive targeted optimisation measures.
6. Analysis of the existing campaign structure and development of an optimised, more detailed campaign structure
A successful Amazon advertising campaign starts with the right structure. Only if your campaigns are clearly organised and well thought out from the outset can you exploit the full potential of your advertising budget.
6.1 Why is a well thought-out campaign structure important?
A poorly organised campaign structure is one of the most common mistakes when creating Amazon advertising campaigns. Not only does it lead to inefficient advertising spend, it also makes optimisation and scaling more difficult. A well-organised structure, on the other hand, offers numerous advantages:
- Campaigns can be analysed more quickly and easily.
- An efficient structure is the basis for targeted optimisation.
- Advertising budgets can be utilised more precisely and effectively.
- The scaling of campaigns is made easier.
Clarity and transparency are guaranteed, even with complex advertising accounts.
6.2 Common mistakes (no-go’s) in the campaign structure
To maximise the efficiency of your campaigns, you should avoid the following mistakes:
- All products in one campaign: Combining heterogeneous products makes optimisation considerably more difficult.
- No division into brand, competitor and generic keywords: This differentiation is crucial for targeted evaluation and optimisation.
- Too many keywords per campaign: This can dilute performance and makes it difficult to make targeted bid adjustments.
- Multiple ad groups per campaign: This reduces the transparency of the results.
- Unclear campaign naming: Without a clear naming scheme, navigation in the advertising console becomes confusing.
- No portfolio structures: Portfolios enable better organisation and goal setting.
- Missing negative keywords in automatic campaigns: Negative brand keywords in particular are essential here to avoid irrelevant spend.
6.3 Development of a sustainable campaign structure
The first step towards an effective campaign structure is to group your products into homogeneous product groups based on search demand.
Example: Suppliers of dog and cat food
A superficial grouping according to “dog food” and “cat food” is not enough. Instead, the structure should the include to enable targeted optimisation.lowest common denominator
From an unspecific structure to a detailed structure:
Instead of bundling all products into one campaign, is dog food divided into the following clusters, for example:
- Wet Senior dog food
- Wet Senior dog food – grain-free
- Wet Junior dog food
- Wet Junior dog food – grain-free
- Dry senior dog food
- Dry senior dog food – grain-free
- Dry dog food Junior
- Junior dry dog food – grain-free
- Dog food snacks senior
- Senior dog food snacks – grain-free
- Junior dog food snacks
- Junior dog food snacks – grain-free
A well thought-out campaign structure is the basis for successful Amazon advertising. It not only enables more precise evaluation and optimisation, but also more efficient scaling. Although setting up a clear structure requires initial effort, it pays off in the long term through better clarity and greater advertising efficiency.
7. Evaluation of the currently used Bid Adjustments
A successful Amazon PPC strategy requires not only the selection of the right keywords and placements, but also the targeted control of bids. Bid adjustment by placement is a powerful tool that allows you to maximise the visibility of your ads in the most lucrative positions and increase your efficiency at the same time.
7.1 What bid adjustments are there?
Amazon offers three different options for bid adjustments in Sponsored Product campaigns:
- First page: Increases the likelihood that your advert will appear on the first page of search results.
- Remaining pages: Refers to ad placements on the remaining search results pages.
- Product placements: Enables the targeted promotion of your products on detail pages of other products.
7.2 Why is it important to analyse bid adjustments?
The correct use of bid adjustments can not only make your adverts more visible, but also more profitable. With the help of regular evaluation, you can:
- Optimise the ROAS (return on advertising spend): Identify placements that achieve a particularly high ROAS and increase bids in a targeted manner.
- Ensure more efficient budget utilisation: Avoid wasting bids on less lucrative placements.
7.3 How to analyse and optimise bid adjustments
Analyse data:
Call up any Sponsored Product campaign and select “Bid adjustments” in the left-hand menu. This will give you an overview of where your SP ads are being displayed:
- First page (this refers to the top positions on the first page)
- Remaining pages (this refers to all placements that are not the top one on the first page)
- Product placements
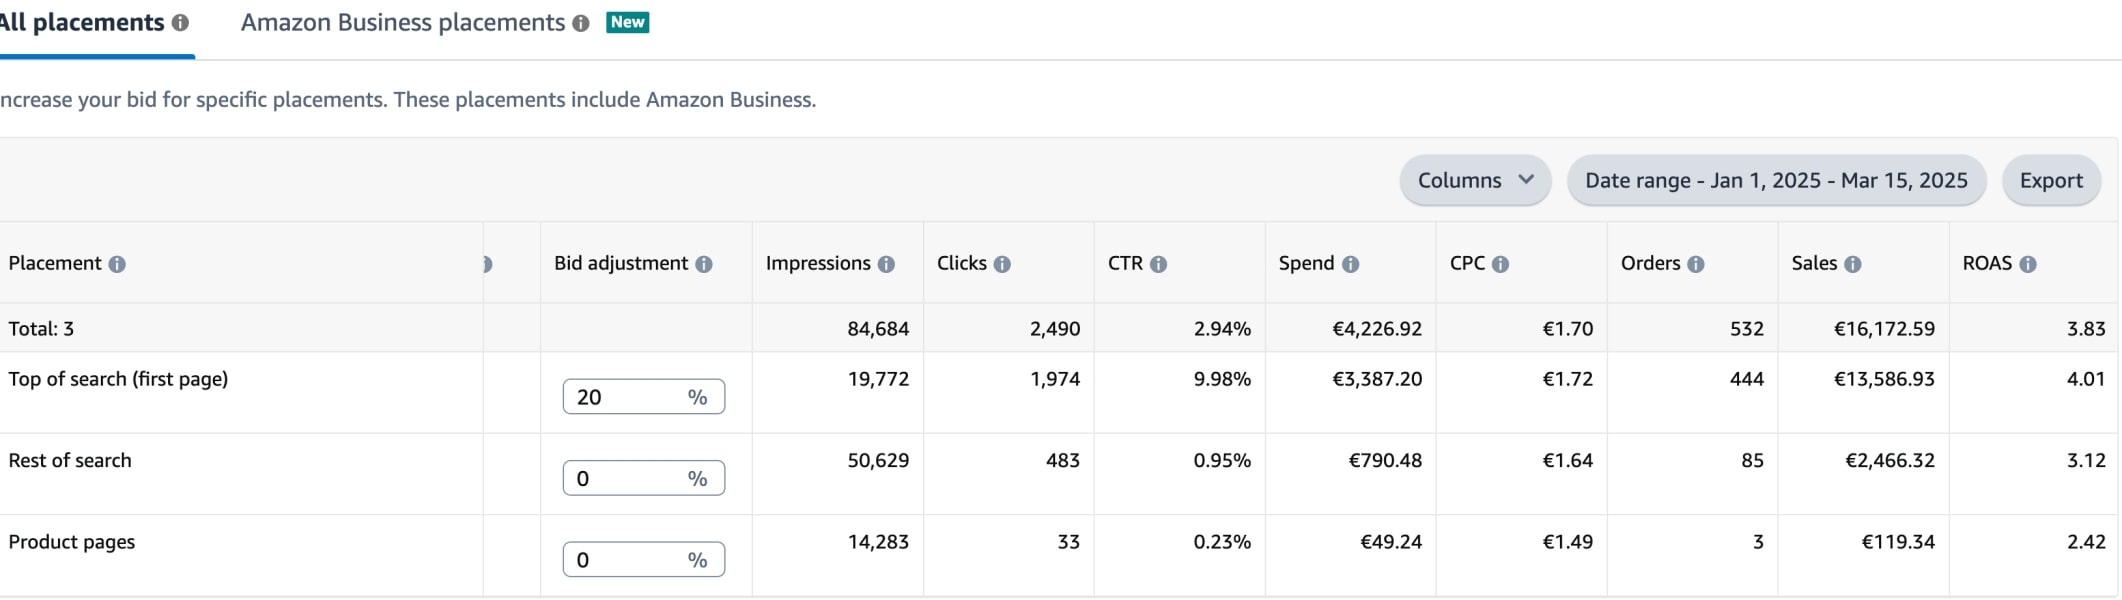
In this screenshot you can see an example of the performance of a Sponsored Product campaign in which bid adjustments of 20% have been selected for the first page.
As a rule, you should use bid adjustments when there is a performance discrepancy between rankings. For example, if the ROAS values for the first page are significantly better than those of the other pages, you would want to use bid adjustments for the first page.
Tip: Carry out this analysis at least once a month to ensure that your bid adjustments are always based on current performance data.
8. Analysis of the current market share in your product category
Understanding your market share is an essential part of analysing the performance of your products on Amazon. By evaluating your sales in comparison to the overall market of a keyword, you gain valuable insights into how strongly your brand is represented in a specific niche or category. This analysis enables you to better evaluate the efficiency of your advertising measures and uncover optimisation potential.
8.1 Why is market share analysis important?
- Comparison with the overall market: Gives you a clear idea of how your product performs in relation to other providers in the category.
- Market position monitoring: Allows you to recognise and react to changes in your market share over time.
- Informed decisions: Helps you assess whether your current strategies are successful or whether adjustments need to be made.
8.2 Procedure: Step-by-step instructions
1. Identify a relevant keyword:
- Choose a keyword that best represents the market for your product.
- Make sure that the keyword has a high search volume and is highly relevant to your product.
- Example: For an organic whey protein powder, the main keyword would be “organic protein powder”.
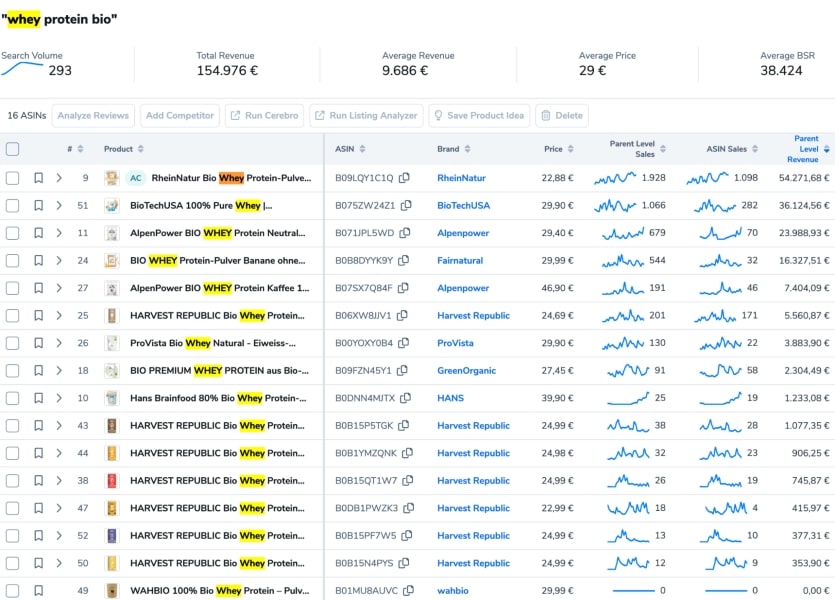
2. Analyse data in Helium10:
- Search for your keyword and filter the results by organic rankings 1-8 to get the most relevant products for market comparison.
- Sort the results by search volume to prioritise the most important search terms.
3. Export of the data:
- Export the data as an Excel file to analyse the performance of the products on the market.
- Remove irrelevant products (e.g. products that do not match your market or keyword).
4. Calculation of market share:
- Analyse the total revenue data for the keyword over the last 30 days.
- Calculate the sales share of your product (or your products, if you have several in the category) compared to the total sales.
5. Regular review:
- Repeat the analysis after one month or another defined period to observe changes in market share.
- Pay attention to how the total turnover of the market has developed:
- If your sales fall, but the overall market falls proportionally more, your market share may have increased.
8.3 Recommendations for action based on the analysis
- Strong market share: Confirms that your products are successfully positioned in the market. Use this to further expand your strategies.
- Declining market share: Analyse the reasons (e.g. competition, price, advertising measures) and adjust your campaigns accordingly.
- Market changes: Identify trends and shifts in the category so that you can react to them at an early stage.
Market share analysis is a simple but extremely effective method of evaluating your position within a category. By regularly comparing your sales with the overall market, you gain valuable insights that help you make informed decisions about your products and advertising measures.
9. Evaluation of the relevance of the top ad placements in your product category
The top ad placements (top of search) play a decisive role for sales success in many product categories. To assess the relevance of these placements for your category, you can use specific data from the Product Opportunity Explorer. This analysis helps you to make informed decisions about the prioritisation and budget of your Amazon advertising campaigns.
9.1 Why is it important to analyse the click distribution?
The click distribution in the search results shows how strongly customers are focussed on the top rankings. A high concentration of clicks on the first search results is an indication that visibility in Top of Search is of crucial importance. Conversely, a more even distribution of clicks means that lower rankings in the search results can potentially be sufficient.
9.2 Procedure: Analyse click distribution
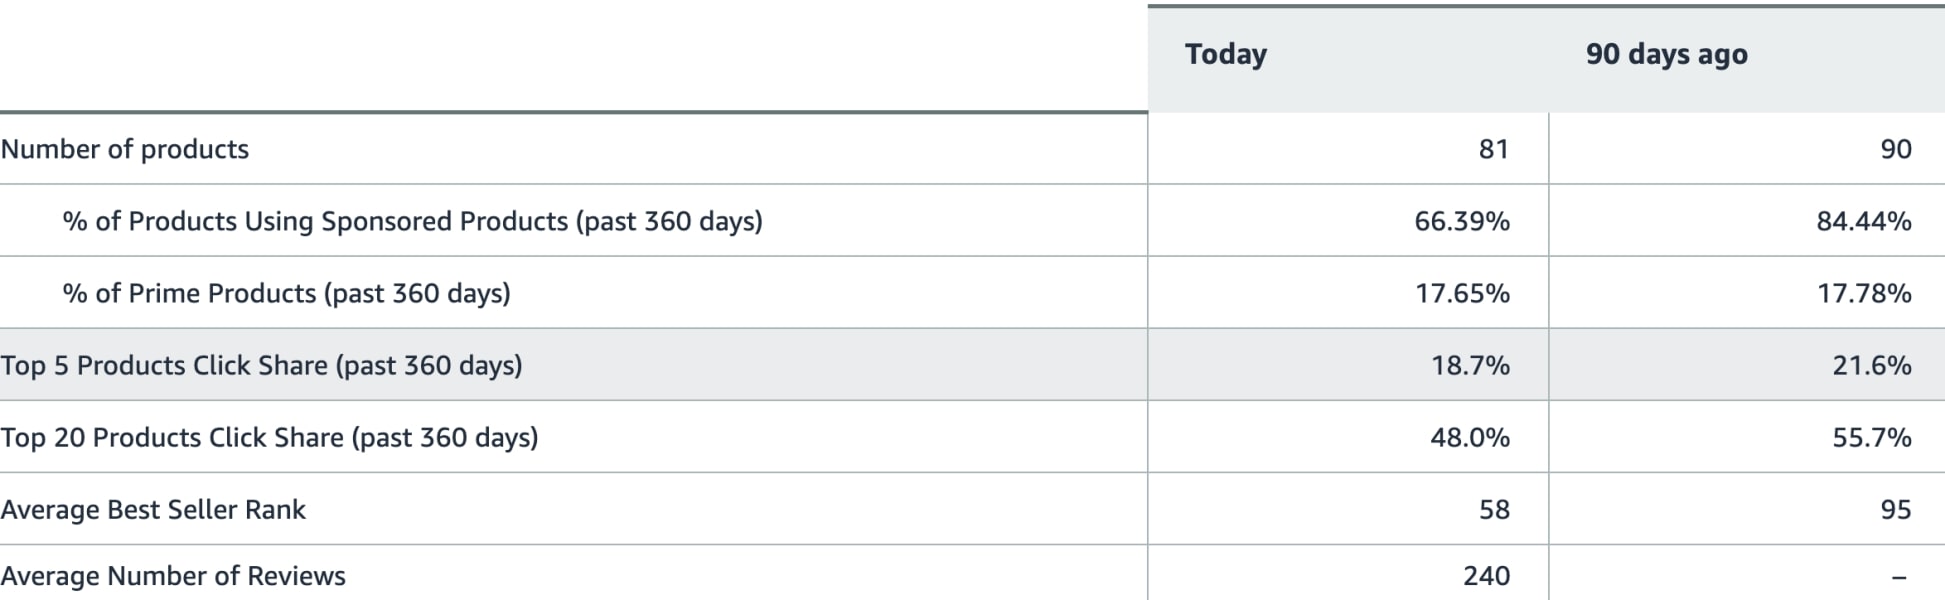
1. Use the Product Opportunity Explorer:
- Open the Explorer and select the category to be analysed.

- Select the “Insights” tab where you will now be provided with category insights

- Here you can find the click distribution for the first 5 and first 20 organic rankings displayed
- You will also see the % number of products with a Prime badge and the % number of products that are running Sponsored Product campaigns
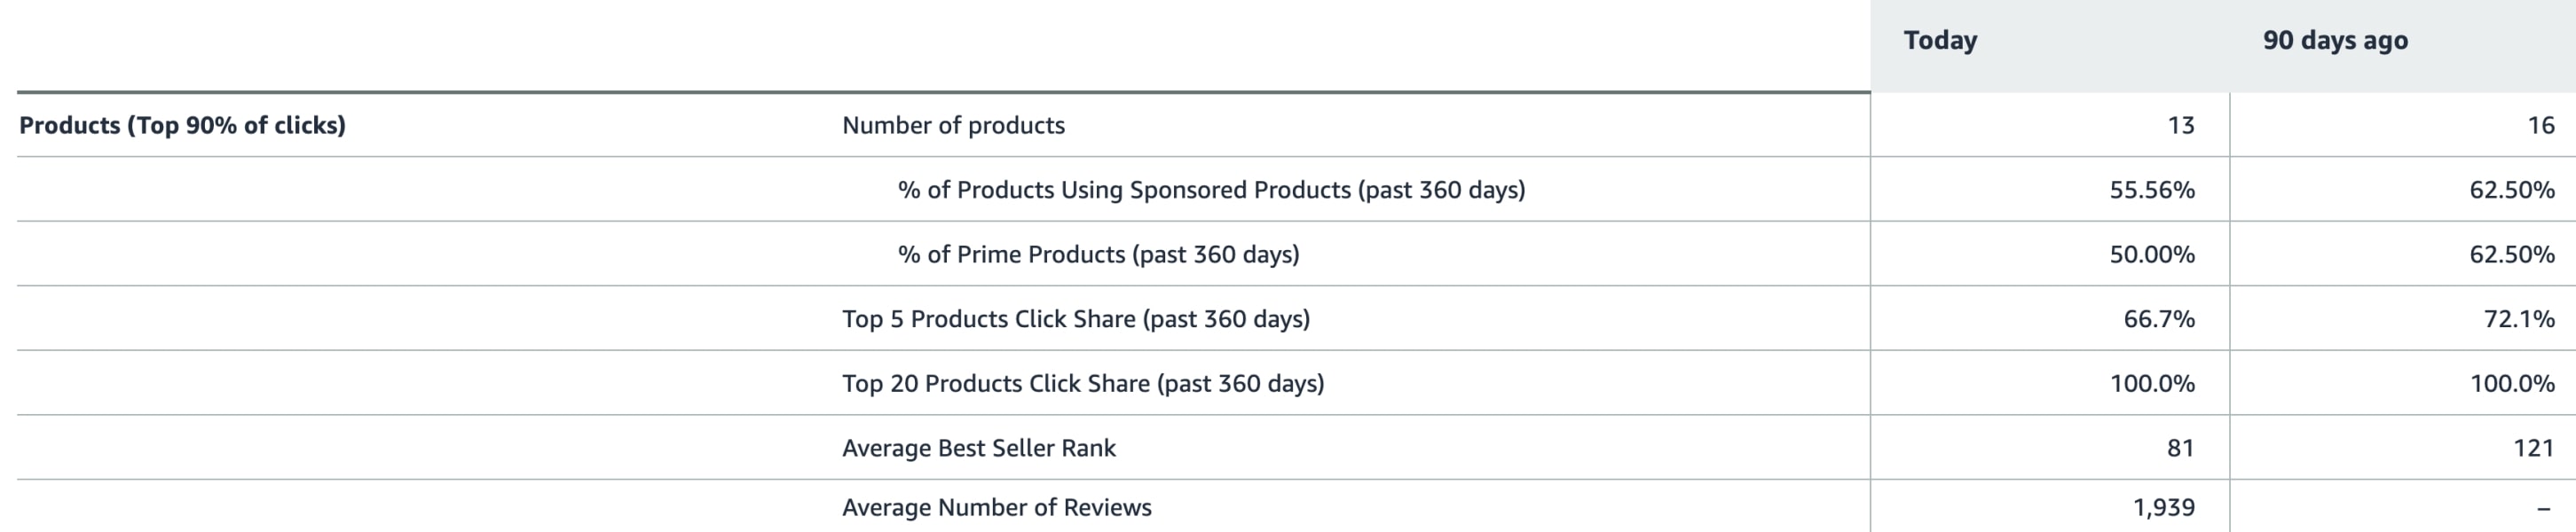
2. Evaluate the click distribution:
High click concentration (over 40-45 % on the first 5 rankings):
- If the majority of clicks are on the first organic placements, the top of search placement is extremely important for adverts in this category.
- In this case, you should ensure that your adverts are regularly displayed at the top, even if this requires higher bids.
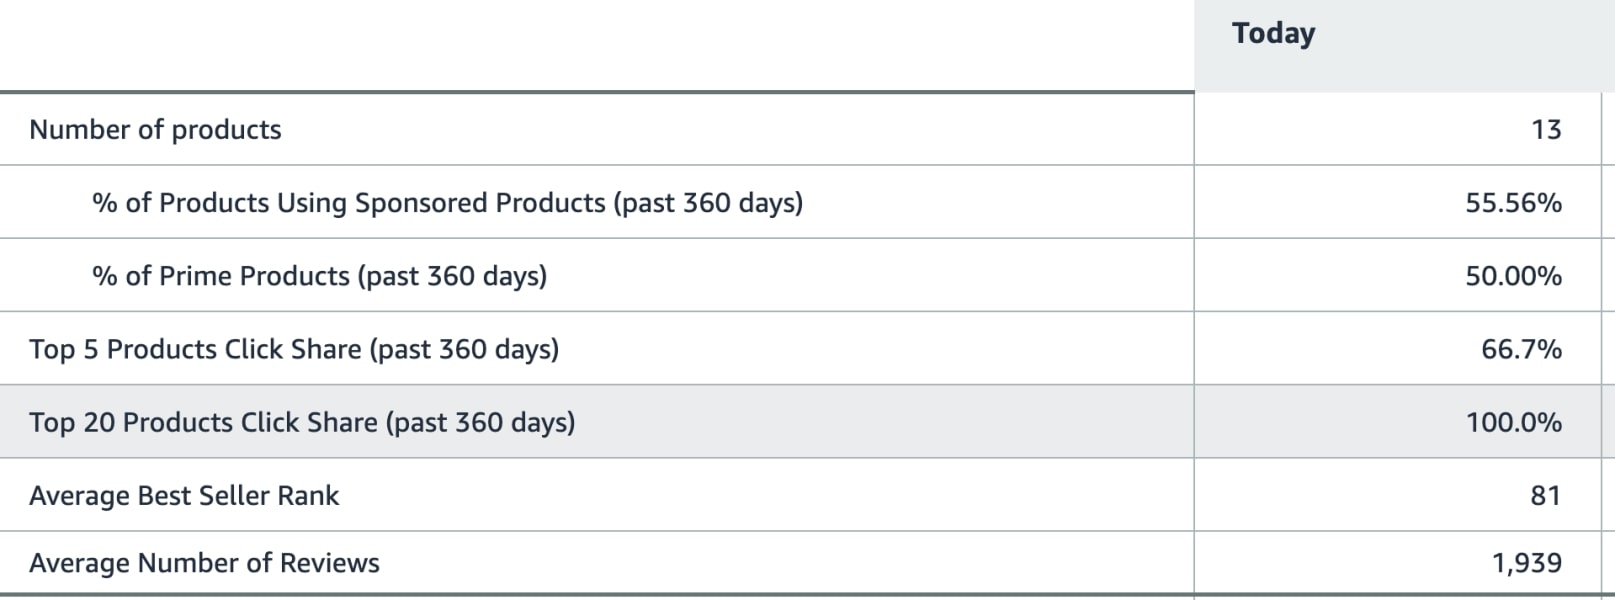
Lower click concentration (less than 20 % on the first 5 rankings):
- If the clicks are more evenly distributed, visibility in Top of Search is less critical.
- In this scenario, you can save on advertising budget and instead offer a more attractive sales price to convince customers.
9.3 Recommendations for action based on the analysis
High click concentration:
- Increase bids for Top of Search to be visible in the highly competitive rankings.
- Use bid adjustments to optimise ads specifically for these placements.
Lower click concentration:
- Avoid overinvesting in top of search rankings.
- Concentrate on price optimisation and medium placements, which can also generate sufficient clicks and sales.
10. Introduction to the Single ASIN and Single keyword campaign strategy
The right campaign structure is a decisive factor for the success of your Amazon PPC campaigns. With the single ASIN and single keyword strategy, you can gain maximum control over bids, budgets and the performance of individual products and keywords. This strategy is particularly suitable for making targeted optimisations and minimising wastage.
10.1 What does the single ASIN and single keyword strategy mean?
- Single-ASIN campaigns: Each campaign is limited to a single ASIN. This allows you to control and analyse the advertising success of a specific product.
- Single keyword campaigns: Each campaign only contains a single keyword. This allows you to align the budget and bid adjustment precisely to the search intention behind this keyword.

10.2 Advantages of the strategy
Maximum control:
By restricting your advertising to an ASIN or a keyword, you can control performance in a targeted manner and analyse it better.
More efficient bid adjustment:
Keywords with high relevance or a high conversion rate can be specifically promoted with higher bids.
Reduction of wastage:
You avoid allocating budgets to irrelevant products or less performing keywords.
Simpler optimisation:
Performance is clear and easy to analyse, as there is no mixing with other products or keywords.
10.3 How do you implement the strategy?
Create single ASIN campaigns:
- Create a separate campaign for each ASIN that you want to advertise specifically.
- Use both automatic and manual campaigns to test relevant keywords and placements.
Create single keyword campaigns:
- Identify keywords with high potential (e.g. keywords with a high conversion rate).
- Create a separate campaign for each of these keywords, ideally with an exact match type.
Regular optimisation:
- Monitor the performance of the campaigns regularly.
- Adjust bids, bid adjustments and budgets to the results achieved.
Add more single keyword campaigns as needed to capitalise on new opportunities.
Conclusion – Amazon PPC Masterclass
Mastering Amazon PPC campaigns requires a strategic approach, continuous analysis, and data-driven decision-making. This guide has provided ten essential optimization techniques to enhance campaign efficiency, reduce wasted ad spend, and improve return on ad spend (ROAS). By implementing structured budget allocation, optimizing keyword strategies, refining campaign structures, and leveraging bid adjustments, you can achieve more profitable results. Staying proactive with market share analysis and ad placement relevance will ensure long-term growth and competitiveness. Consistently applying these insights will help you maximize your Amazon advertising success.
***