Key takeaways from the SaleCycle Ecommerce Stats & Trends report

Ecommerce statistics and trends report 2022: All nuts and bolts
If you run an e-commerce business, you’re undoubtedly interested in more than a few statistics. We have prepared a shortened report for you based on SaleCycle’s 2022 Ecommerce Stats & Trends Report.
SaleCycle collected the data from 8,399,948,374 online customer journeys. The trends are also supported by data from 178,161,675 emails sent and 164,234,227 online sales tracked in a variety of sectors.
Using this information, we will provide you with expert insights and marketer takeaways that will help you understand user behavior and increase your conversion rate.
Prepare yourself for a lot of charts and insights!
Key takeaways
- Both consumers and businesses adopted ecommerce as a result of the pandemic.
- From start to finish, consumers expect brands to deliver a polished experience.
- Consumers who previously wouldn’t have shopped online are now doing so.
- Businesses are trying to be agile and move with the times, just as consumers are doing the same.
- It’s a huge opportunity to offer products online or increase their digital marketing channels to attract new customers.
- Online sales, advertising, and marketing will be transformed by the post-pandemic recovery.
Online sales trends
The amount of online buying activity peaked in November at 9.99%, which is not surprising given Black Friday and Cyber Monday.
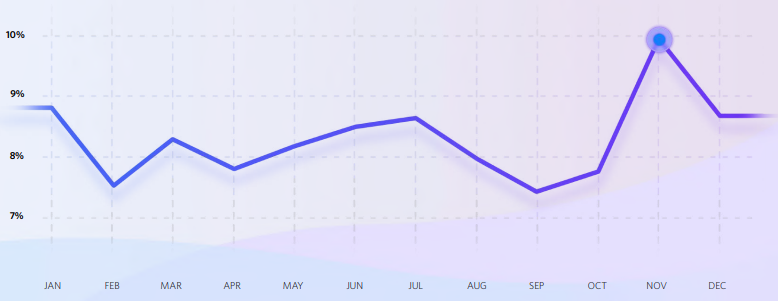
source: SaleCycle’s 2022 Ecommerce Stats & Trends Report
Online sales volume picks up significantly from the 25th until the end of the month, except on the two last days. However, the 26th of the month throughout 2021 was the most popular day for online sales.
Thursday was the most popular day of the week for online sales over the past five years. This trend is changing, however. In 2021, SaleCycle data revealed that Monday was the most popular day for online deals.
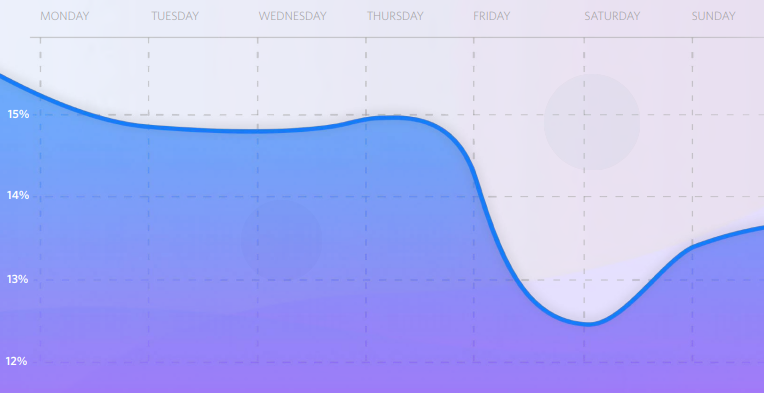
source: SaleCycle’s 2022 Ecommerce Stats & Trends Report
As in 2021, peak times for online sales are 11:00 and 20:00. It seems that despite changes in online shopping behavior, the typical buying times remain the same each day.
Furthermore, 56% of online sales come from mobile devices and 44% from desktop computers.
Email marketing
The key email marketing insights are about average open rate, average click rate, and average conversion rate.
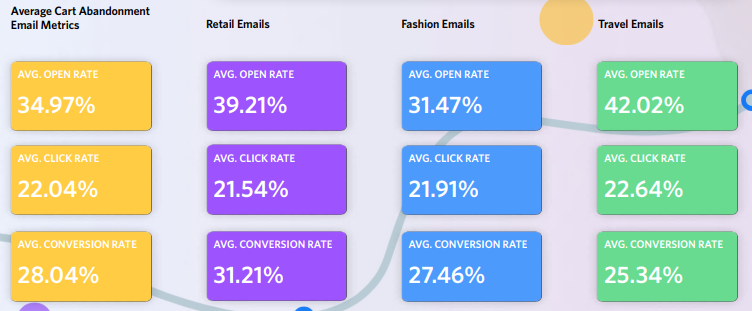
source: SaleCycle’s 2022 Ecommerce Stats & Trends Report
In 2021, the overall cart abandonment rate was 80.68%, slightly lower than 81.08% from the previous year. What’s more, customers don’t always buy on their first visit. Usually, they shop around for lower prices, different payment options, or faster and cheaper delivery.
The number of abandoned carts remains stable throughout the year. However, December and November typically see lower abandonment rates and higher traffic volumes, which was also the case in 2021.
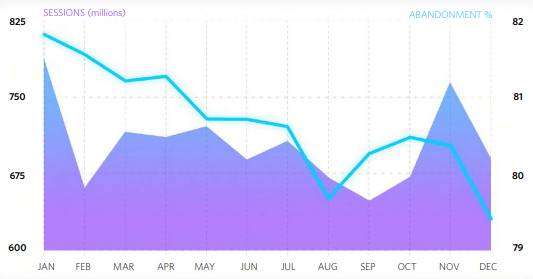
source: SaleCycle’s 2022 Ecommerce Stats & Trends Report
In addition, abandonments remain similar throughout the month. In comparison to the middle of the month, they are slightly higher in the first and last week of the month.
Fashion
The cart abandonment rate for consumer fashion is significantly lower than for luxury fashion. There is a significant difference in the average order value (AOV) between the two.
Retail
The cart abandonment rates for telco, automotive, and home furnishings were among the highest. Conversely, groceries and cosmetics had the lowest abandonment rates.
Segments that fit into a replenishment or subscription model would have a much lower abandonment rate in retail. It is unnecessary to conduct research or gather social proof for key issues. Why? Because customers have already used the products multiple times.
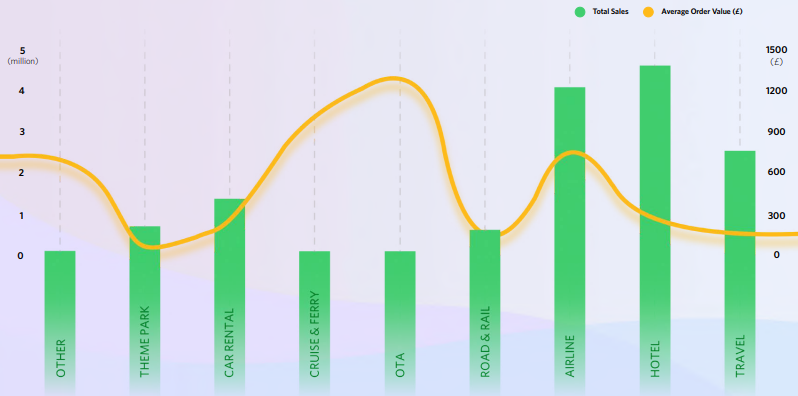
Travel
There is a higher abandonment rate in the travel industry. For example, airlines have an abandonment rate of above 90%. The pandemic can explain part of that.
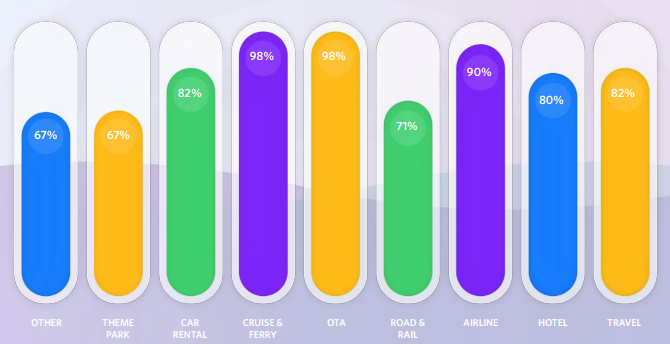
source: SaleCycle’s 2022 Ecommerce Stats & Trends Report
Online traffic trends
According to SaleCycle data, January had the most sessions in 2021. However, November has historically seen the highest amount of online traffic, usually by a wide margin.
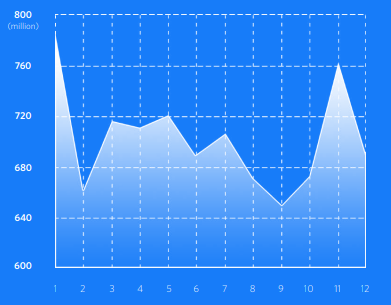
source: SaleCycle’s 2022 Ecommerce Stats & Trends Report
If we’re talking about online traffic by hour, 20:00 – 21:00 is the busiest time of the day for website traffic. 3:00 – 6:00 is when there’s the least amount of traffic.
Additionally, mobile traffic was 71.23%, which is 3% higher than last year. So although the travel industry hasn’t seen as much traffic as other industries, it still represents a substantial amount of users who are mobile-first browsers.
Moreover, SaleCycle has prepared this little chart that shows an online traffic timeline that can greatly help you and your sales strategy.
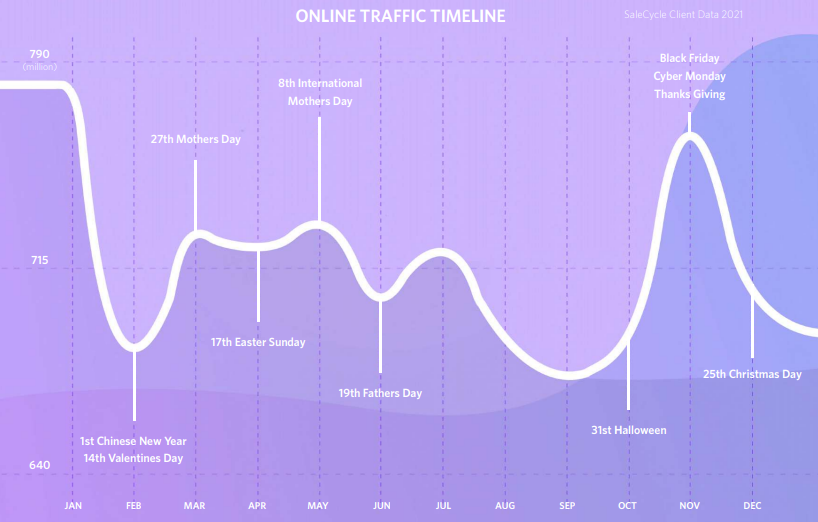
source: SaleCycle’s 2022 Ecommerce Stats & Trends Report
Ecommerce by industry
The fashion industry’s online sales are much more mobile-centric, with 79% of the market coming from mobile devices.
Retail
In 2021, grocery sales dominated the retail industry. January has a slightly higher online sales volume than November, making it the peak in 2021.
As a result of pandemic precautions, more shoppers are buying food online. Sales in other sectors such as Sport & Outdoors and Home Furnishings have also been impressive. The pandemic has significantly impacted both sectors.
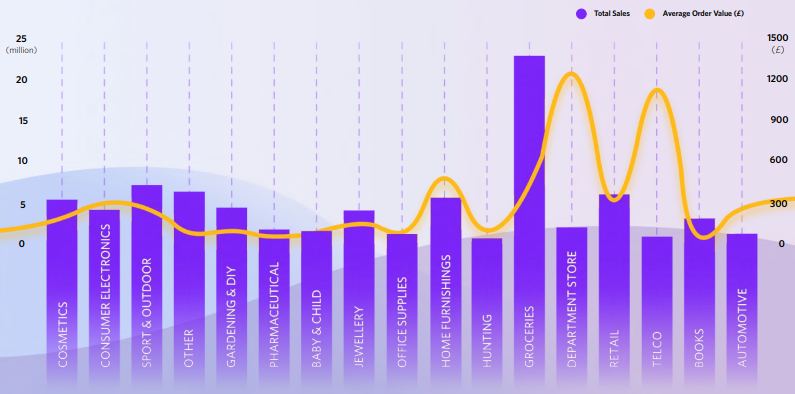
source: SaleCycle’s 2022 Ecommerce Stats & Trends Report
Fashion
November is the best month for online sales, with January being the second most popular. Also, the 26th of the month is the most popular day for online shopping. And similar to retail, January edged November to be the busiest month for online sessions.
Travel
We all know the pandemic has caused major issues within the travel industry.
source: SaleCycle’s 2022 Ecommerce Stats & Trends Report
However, online sales in the travel industry began to increase in May and July was the best month for online sales. At the end of the year, online sales grew much faster than they did at the beginning of the year.
Interestingly, the first three days of the week have more online sales volume, with Monday being the most popular. Saturday and Sunday are the least popular days, with Saturday significantly lower than weekdays.
Global ecommerce insights
Mobile devices are the most popular method of completing online purchases – in Europe, mobile sales lead the three main ecommerce markets: Retail, Fashion, and Travel. However, Asia & Pacific are those who have the highest online traffic from mobile.
What’s more, cart abandonment rates are the highest in North America. Additionally, they rely more on desktop sales, which are usually associated with higher average order values.
To sum up
We just gave you the essential ecommerce statistics and reports. Now you know understanding your customers and optimizing your purchase funnel can help you recover online sales.
You can use the information presented for your business – for example, you can optimize your store for mobile devices or improve your site to decrease your cart abandonment rate. Good luck!