Top e-commerce statistics for individuals [Eurostat Statistics Explained]
Here are key e-commerce statistics for individuals with Eurostat’s insights. Stay informed and make smarter choices in your online shopping journey today!

Here’s a quick overview of the top e-commerce statistics for individuals in 2023. These key insights from Eurostat Statistics Explained reflect the state of online shopping in the EU and cover everything from who is shopping online to how frequently they are buying.
Take a moment to read, as this snapshot provides a comprehensive look at the trends and behaviors shaping the digital market in Europe.
So, let’s explore how the e-commerce landscape in the EU has shaped up in 2023 and what it means for 2024!
The state of e-commerce in the EU
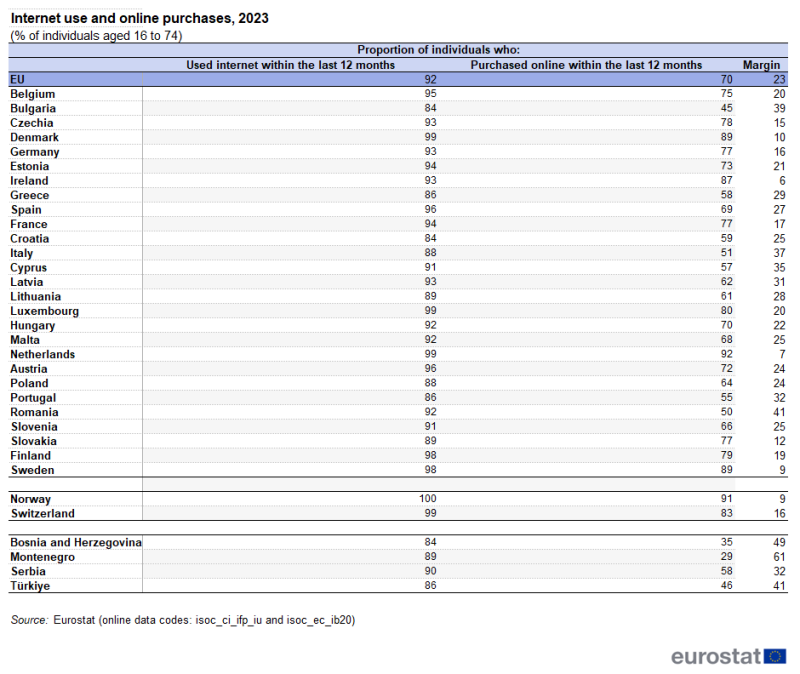
The numbers are pretty impressive – 92% of people aged 16-74 in the EU used the internet last year, and a whopping 70% of EU citizens ordered goods or services online! This is an increase from 2022, which shows that online shopping is becoming even more common.
Source: E-commerce statistics for individuals, Eurostat Statistics Explained.
What’s driving this? Well, e-commerce is all about convenience. Who doesn’t love browsing through a wide range of products, comparing prices, and reading reviews from other buyers – all from the comfort of your own home? Even though in-person shopping returned after the pandemic, e-commerce kept growing, supported by these key benefits.
But it’s not just about convenience. Another factor at play is income and education. People with higher levels of education and stable employment are more likely to shop online. We will discuss this later, but the data indicate a strong correlation between economic status and e-commerce participation.
Moreover, in 2023, the top countries with the highest shares of online customers in the EU were:
- the Netherlands (93%),
- Sweden (91%),
- and Denmark (90%).
Other countries like Estonia, Romania, and Bulgaria are catching up. The lowest shares were reported by Italy (58 %), Romania (55 %), and Bulgaria (54 %), but the trend is still clear – e-commerce is here to stay.

Source: E-commerce statistics for individuals, Eurostat Statistics Explained.
E-shopping
When we talk about e-shopping, we need to recognize how much this trend has evolved, especially in the past decade.
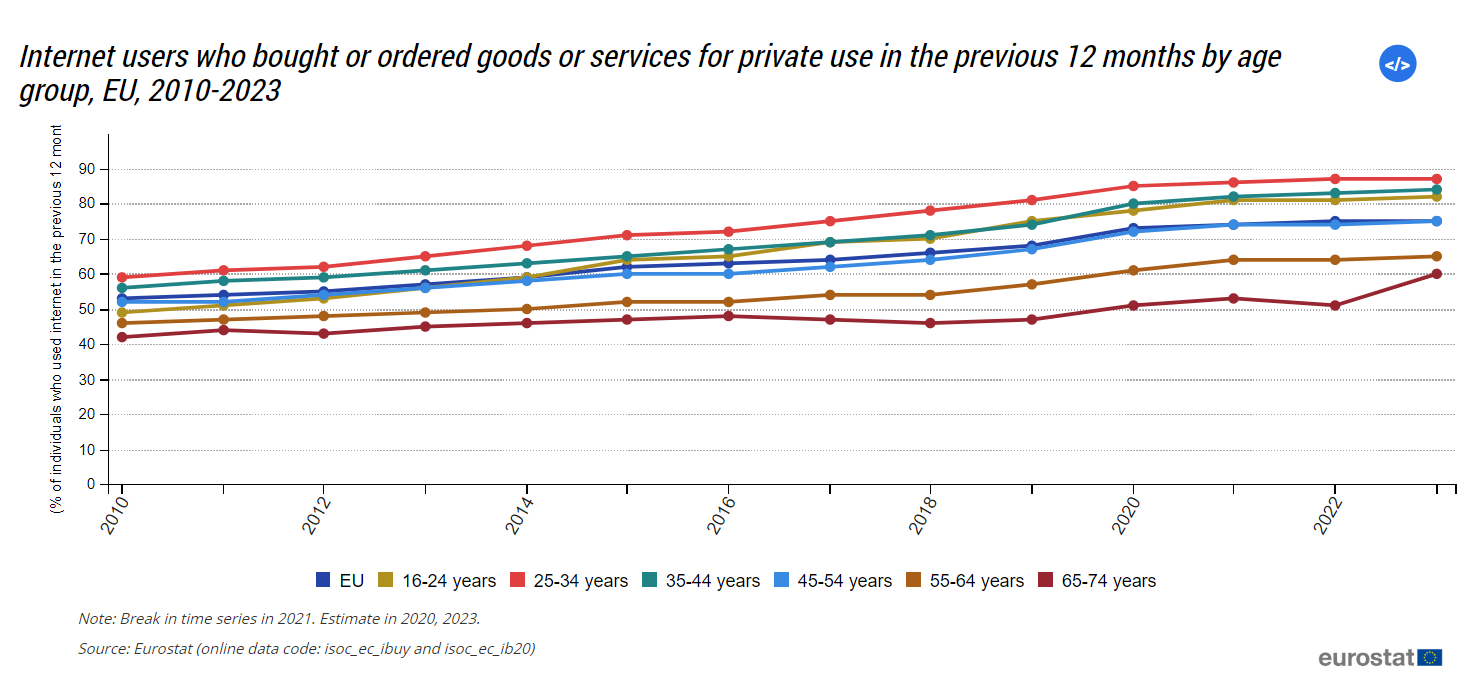
In 2023, 75% of internet users in the EU bought something online. That’s a huge leap from 57% just ten years ago. But what’s even more interesting is the generational divide in how people shop online.
Younger generations, especially those aged 25-34, are the most active e-shoppers, with 87% making online purchases last year. What’s behind this? It could be their comfort with technology or the ease of using mobile devices to shop on the go. On the other hand, older generations, particularly those aged 65-74, are still more hesitant, with only 52% making online purchases.
Source: E-commerce statistics for individuals, Eurostat Statistics Explained.
However, even with these differences, e-shopping is becoming a norm across all age groups. It’s not just about buying clothes or electronics anymore. From ordering meals to purchasing beauty products, the variety of items people buy online continues to expand.
But let’s not forget that the convenience of online shopping comes with expectations.
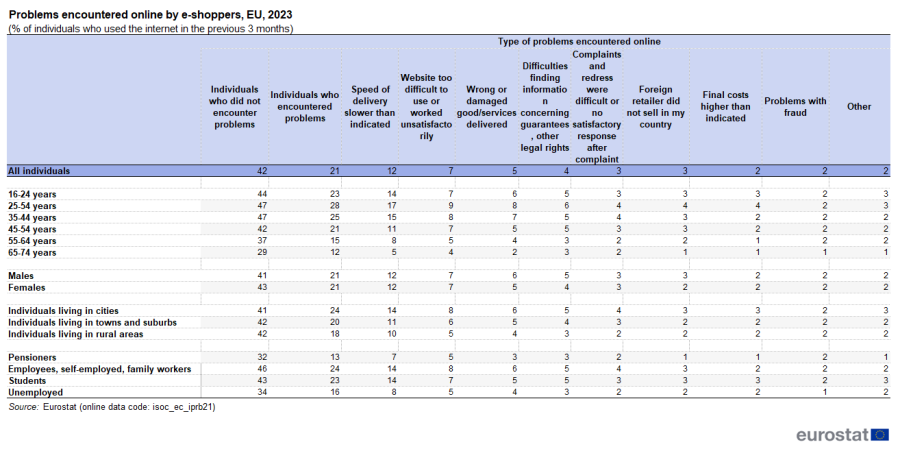
Fast delivery, easy returns, and flexible payment options are crucial. If businesses fail to meet these expectations, they risk losing customers to competitors who can. Fortunately, in 2023, 42% of e-shoppers reported no issues while buying online, which is a good sign, but there’s still room for improvement in delivery speed and customer service.
Source: E-commerce statistics for individuals, Eurostat Statistics Explained.
As e-shopping continues to grow, meeting consumer expectations will be key to staying competitive in this rapidly evolving digital marketplace.
Education and shopping online
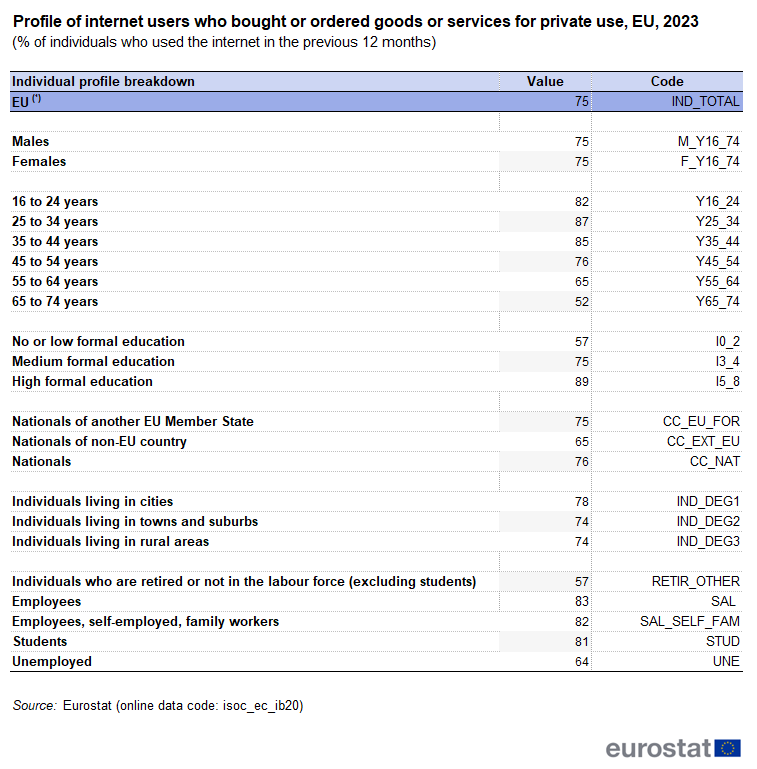
As we said before, when it comes to online shopping in the EU, education plays a big role in determining how likely individuals are to engage in e-commerce. In 2023, the data showed a clear correlation: the higher the level of education, the more likely a person was to shop online. For example, up to 89% of those with a high formal education background made online purchases, while only 57% of those with no or low formal education did the same.
Source: E-commerce statistics for individuals, Eurostat Statistics Explained.
What’s behind this trend? Higher education often brings a higher level of digital literacy, as well as greater comfort and trust in using online platforms. Additionally, individuals with advanced education often have more disposable income, which enables them to shop online more frequently.
This pattern is seen across most EU countries and demonstrates that e-shopping is closely tied to educational attainment.
Top categories of online purchases in 2023
What were the most popular items bought online in 2023? The answer is one – fashion!
In fact, 44% of e-shoppers in the EU purchased clothes, shoes, and accessories online. Right behind fashion were restaurant deliveries (19%) and beauty products (18%). This variety shows how diverse e-shopping has become.

Source: E-commerce statistics for individuals, Eurostat Statistics Explained.
For the younger generations, like those aged 16-34, fashion reigns supreme, with over half of them purchasing clothes and shoes online. Meanwhile, older age groups, particularly those aged 55-74, are more likely to buy furniture, home accessories, or medical supplements online.
Frequency of the purchases
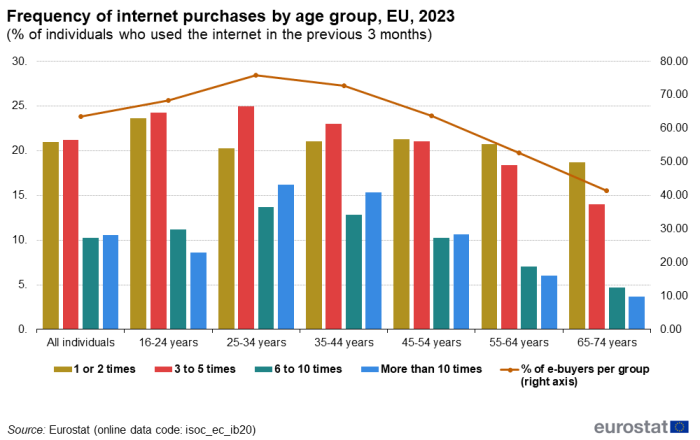
Now, let’s see how often people in the EU shop online. In 2023, 21% of e-shoppers made one or two purchases in the three months before the survey. Another 21% reported buying three to five times within the same period. For more frequent shoppers, 10% made six to ten purchases, and 11% bought something online more than ten times. In more detail:
- 24 % of respondents aged 16-24 made a purchase once or twice, and another 24 % made a purchase three to five times.
- Within the 25–34 age group, 25% made three to five online purchases. Interestingly, 16% of this age group had made more than ten purchases in the last 3 months prior to the survey.
- For the 35–44-year-old group, the highest proportion was for ‘three to five purchases,’ and a relatively high rate was for those who made more than ten purchases.
- The highest proportion of individuals in age classes 55-64 years and 65-74 years made one or two internet purchases.
Source: E-commerce statistics for individuals, Eurostat Statistics Explained.
So, the younger generation, especially those aged 25-34, is leading the charge with more frequent purchases. Meanwhile, the older age groups, like those aged 55-74, tend to make fewer purchases.
National sellers
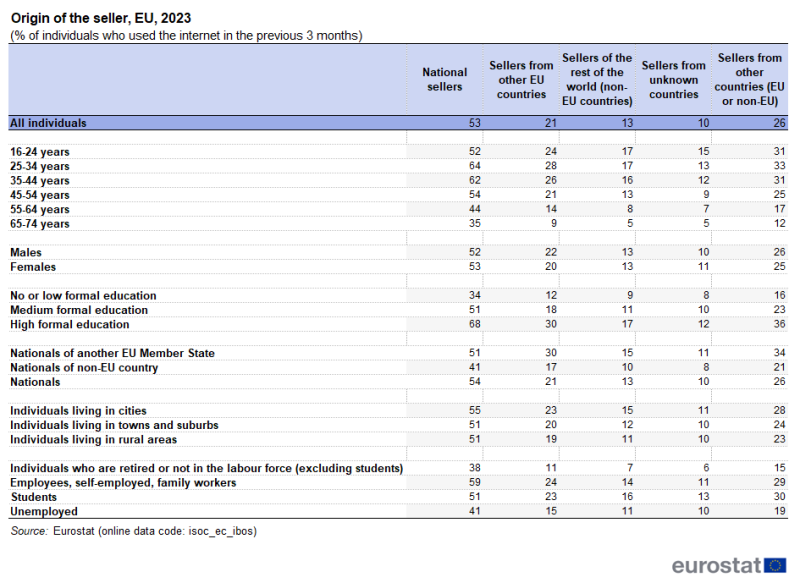
In 2023, most EU shoppers still preferred buying from national sellers:
- about 53% of online purchases were made from domestic sellers,
- 21% came from other EU countries,
- and 13% from outside the EU.
It’s clear that shoppers feel more comfortable buying within their own country, but cross-border e-commerce is gaining traction, especially among younger consumers.
Source: E-commerce statistics for individuals, Eurostat Statistics Explained.
Interestingly, those with higher education levels were more likely to buy from foreign sellers. This shows that educated shoppers are more open and trusted when exploring international markets. They use global deals and expand their purchasing options beyond national borders.
Collaborative economy
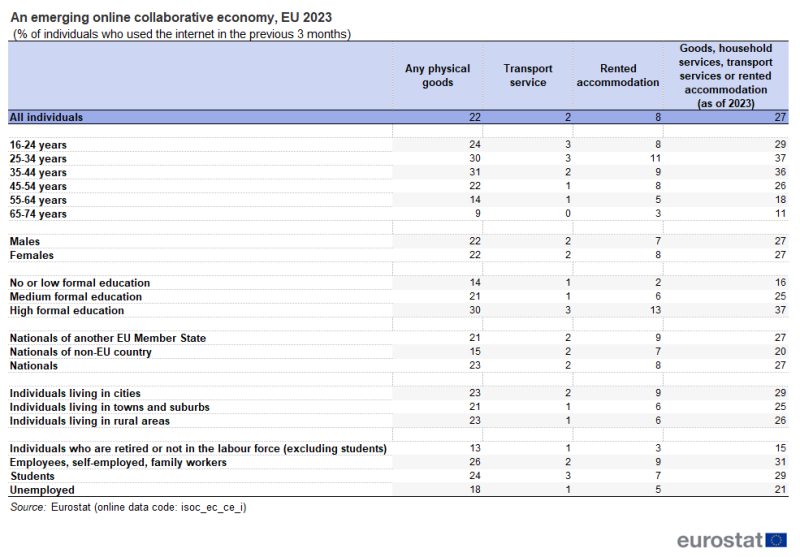
The concept behind the collaborative economy is simple: individuals connect directly through platforms to buy, sell, or exchange goods, often benefiting from lower prices and a more sustainable approach to consumption.
In 2023, the collaborative economy – often referred to as the “sharing economy” – changed across the EU. Interestingly, when it comes to the types of transactions conducted within this model, the purchase of physical goods outpaced the demand for services.
Data revealed that 22% of EU consumers participated in buying or exchanging physical goods via collaborative platforms. In comparison, only 8% were engaged in renting accommodation, and 2% used transport services such as ride-sharing.
Younger age groups, especially those aged 25-34 and 35-44, were the most active participants in the exchange of goods. They created a trend that showcases a growing comfort among younger consumers in using platforms to buy second-hand items, ranging from furniture and clothing to electronics.
Source: E-commerce statistics for individuals, Eurostat Statistics Explained.
This surge in physical goods trading reflects a move toward sustainability, as consumers prioritize reusing and recycling items rather than purchasing new ones. And as this trend continues to grow, it’s clear that:
- physical goods in the collaborative economy are here to stay,
- services like accommodation and transport play rather a supporting role.
Key takeaways
To wrap up the key points, below are some of the most compelling takeaways that can help individuals better understand the current state of EU e-commerce.
- 92% of individuals aged 16-74 in the EU used the internet, with 70% actively shopping online. They showcase a strong digital presence across Europe.
- Younger age groups dominate e-commerce, while older individuals (55-74) show lower participation but gradually increase their online shopping activity.
- Higher levels of education and employment status correlate strongly with higher e-commerce participation.
- Clothing, shoes, and accessories topped the list of online purchases, followed by restaurant deliveries, cosmetics, and home furnishings.
- The most common online shopping frequency was 1-5 times every three months, with younger individuals making the most purchases.
- 53% of e-commerce transactions were made from domestic sellers, with the rest being cross-border purchases from other EU countries or beyond.
- 42% of EU e-shoppers reported no problems when purchasing online. On the other hand, the main issues are slow delivery and website usability.
- 22% of EU consumers engaged in the exchange of physical goods through collaborative platforms, with a smaller demand for services like accommodation or transport.
Conclusion
As we look ahead to 2024, the e-commerce statistics we’ve explored in this article show an industry that will grow. With the majority of EU citizens actively purchasing goods and services online, businesses must continue to adapt to meet changing consumer demands.
The rise of national sellers, the increasing frequency of purchases, and the growing popularity of collaborative economies all highlight key opportunities for retailers to expand their online presence.
The takeaway? There’s never been a better time to invest in digital platforms and strategies that cater to this evolving market.