Top Findings – Global Ecommerce Overview [Statista Dossier]

E-commerce has become an integral part of global retailing over the last few years, and so much has already been said about this sector. But not everything. We can go on and on about e-commerce, so this time we are going to take a look at the information about the e-commerce industry, taking into account the whole world.
So what does the picture of e-commerce look like in 2021, according to data? Let’s see what Statista has to say!
E-commerce on the rise
With the advent of the internet, retail has undergone a substantial transformation. Thanks to the ongoing digitalization of modern life, consumers from virtually every country now take advantage of online shopping. Every year, the number of digital buyers keeps increasing as internet access and adoption rise worldwide.
The number of digital buyers worldwide from 2014 to 2021

source:https://www.statista.com/statistics/251666/number-of-digital-buyers-worldwide/
In 2021, over 2.14 billion people worldwide bought goods and services online, up from 1.66 billion global digital buyers in 2016.
Of course, there are more and more digital buyers. This is influenced by the fact that purchasing goods and services online has become a common practice among many people. In addition, customers are affected by various digital resources when shopping, such as brand emails and product reviews.
We all know that the internet plays an increasingly important role in retail. For example, approximately 20 percent of all retail sales worldwide were made through e-commerce in 2021. What’s more, it’s estimated that by 2025, the online sector will account for almost a quarter of all retail sales worldwide.
A total retail sales worldwide from 2015 to 2025
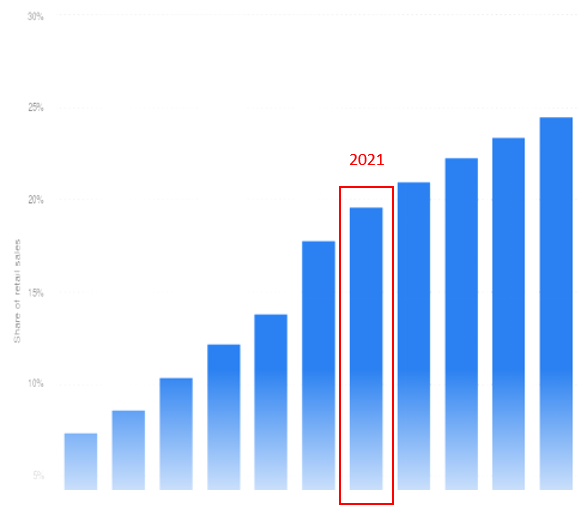
source:https://www.statista.com/statistics/534123/e-commerce-share-of-retail-sales-worldwide/
Also, according to Statista, e-commerce in the United States was worth approximately $469.2 billion in 2021, up from $431.6 billion in 2020. In the third quarter of 2021, e-commerce accounted for 13 percent of total U.S. retail sales, down from a high of 15.7 percent in the second quarter of 2020 but still up from a pandemic level of 11.3 percent in the fourth quarter of 2019.
source:https://www.statista.com/statistics/272391/us-retail-e-commerce-sales-forecast/
Market leaders in the world of e-commerce
Uber ranks as the world’s top online marketplace with a market cap of over 94 billion dollars. According to June 2021 data, the United States-based company ranks ahead of Mercado Libre and DiDi Global competitors.
In addition, JD Health ranks first among the world’s leading vertical e-commerce companies with a market cap of over 45.6 billion U.S. dollars.
Statista also provides information about leading consumer internet and online service companies worldwide as of June 2021. The graph is as follows:
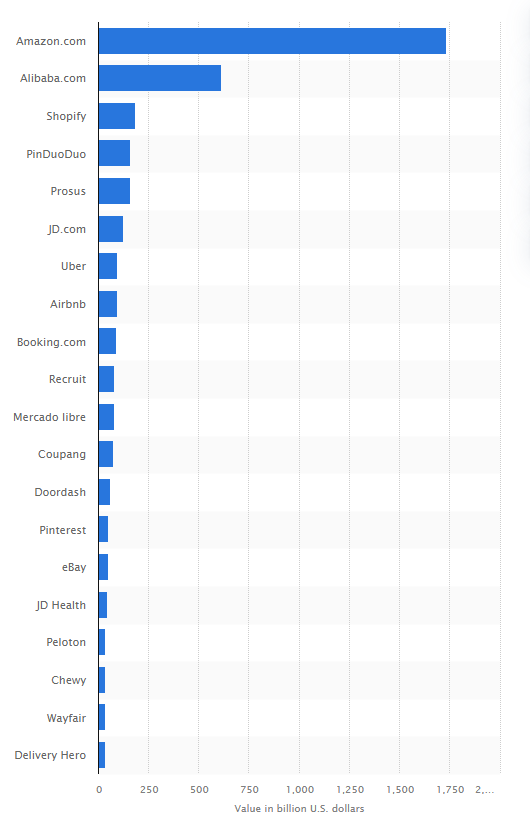
source:https://www.statista.com/statistics/208843/stock-market-value-of-web-based-companies/
As of June 2021, Amazon has a market cap of approximately 1,735 billion U.S. dollars, making it the most significant consumer internet and online service company in the world. In addition, this company was ranked first among the various online companies in the retail, real estate, mobility, travel, and hospitality sectors.
Digital commerce platform Alibaba.com was ranked second with a market cap of 614.8 billion U.S. dollars. The third place belongs to Shopify, with a market cap of approximately 230 billion U.S. dollars.
For comparison, the most visited online retail websites in the world in 2020, by average monthly traffic, were as follows:
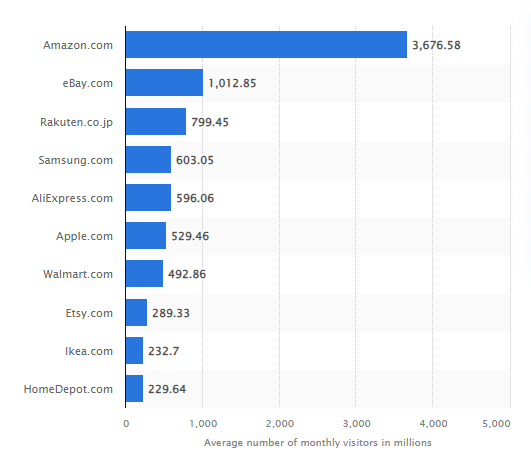
source:https://www.statista.com/statistics/274708/online-retail-and-auction-ranked-by-worldwide-audiences/
Despite the global coronavirus pandemic, online retail websites have experienced strong traffic gains as many of the population were staying at home and ordering items online that they usually would purchase in-store. Almost 3.68 billion people visited Amazon each month in 2020, followed by 1.01 billion on eBay.com.
Mobile devices and websites are boosting e-commerce traffic
Let’s be honest, we like online shopping, but most of us have used an app at least once to make a purchase. And that’s not news.
For a more convenient and smooth shopping experience, many brands invest in shopping apps along with mobile-optimized websites. For example, Amazon Shopping was the most popular shopping app in the U.S. in 2020, with an average of 1.5 million daily active users. What’s more, apps are available for online businesses and brick-and-mortar retailers.
The e-commerce site conversion rate decreased as the screen size got smaller in the fourth quarter of 2021. The highest conversion rate was found on desktop devices, followed by tablets, and then mobile devices.
The number of pages seen at buying sessions worldwide in 2021 by vertical it’s also interesting. It looks like this:
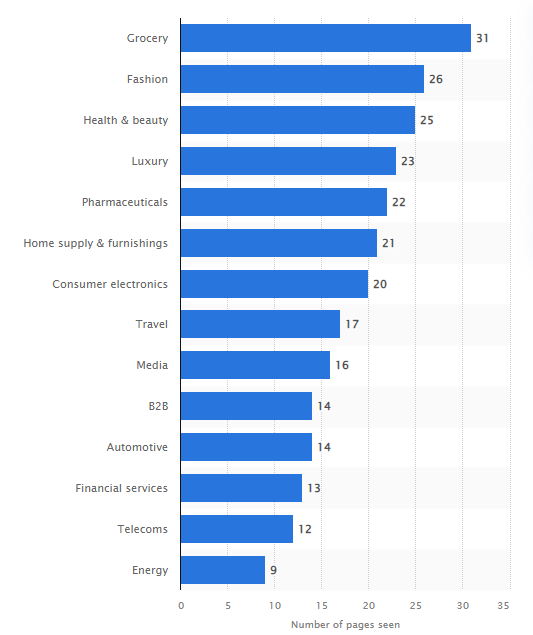
source:https://www.statista.com/statistics/1106617/number-of-pages-seen-buying-session/
Online grocery shoppers browsed an average of 31 pages per shopping session. This is higher than those buying fashion online (26 pages). Shoppers in these industries were more likely to browse the offerings and add multiple items to their carts. There were fewer product options in sectors such as energy (9 pages per shopping session).
To sum up
As you can see, a lot was going on in 2021. E-commerce had already gained momentum in 2020; a year later, it got even bigger. Brands’ awareness increased, and more companies got into e-commerce as they noticed that consumers were spending more and more money online.
How will 2022 end? We’ll see!