100+ Germany E-commerce Statistics for 2026
Discover the top 100+ statistics about e-commerce in Germany. Stay informed with essential insights and trends shaping the online retail landscape.

Germany’s e-commerce market returned to steady growth in 2025. Online retail revenue reached €92.3 billion, while the forecast for 2026 points to €96.3 billion. Growth now comes from more than fashion and electronics. Groceries, health products, marketplaces, mobile shopping and AI-assisted product research are reshaping the market.
Below are more than 100 current statistics covering the size, structure and direction of German e-commerce.
A note on the data
Most market values in this guide come from the HDE Online-Monitor 2026. HDE measures B2C online sales of new physical and digital goods in Germany. Values are net of VAT and adjusted for returns. Services, travel, tickets, streaming and online rentals are excluded.
Secondhand revenue is reported separately. Shopper adoption figures come from Destatis, while the payment section uses Deutsche Bundesbank data. Figures from different sources should not be treated as directly interchangeable because their market definitions differ.
Germany e-commerce statistics at a glance
| Metric | Latest figure | Period |
| German online retail revenue | €92.3 billion | 2025 |
| Annual online revenue growth | 3.9% | 2025 |
| Forecast online retail revenue | €96.3 billion | 2026 |
| Forecast annual growth | 4.3% | 2026 |
| Online share of retail sales | 13.5% | 2025 |
| Online market including secondhand | Approx. €103 billion | 2025 |
| Revenue generated through marketplaces | 56.7% of online sales | 2025 |
| Revenue generated on mobile devices | 69% | 2025 |
| Smartphone share of online revenue | 61% | 2025 |
| Average number of online orders | 35.2 per shopper | 2025 |
| Average spend per online order | €53.20 | 2025 |
| Secondhand online revenue | €10.5 billion | 2025 |
| Consumers using AI for product research | 35% | 2025 |
| Consumers consciously ordering abroad | 26% | 2025 |
| Temu and Shein share of online retail | Approx. 5% | 2025 |
| Estimated TikTok Shop revenue | Approx. €220 million | 2025 |
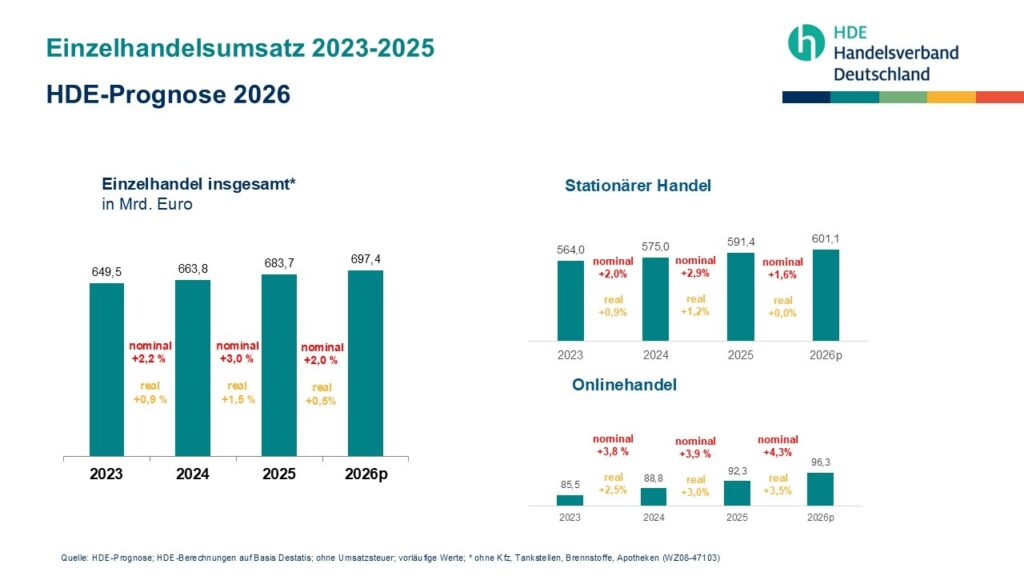
Germany’s online market added €3.5 billion in net revenue during 2025. Its growth rate once again exceeded offline retail growth, although physical stores still account for most German retail spending.
How large is the German e-commerce market?
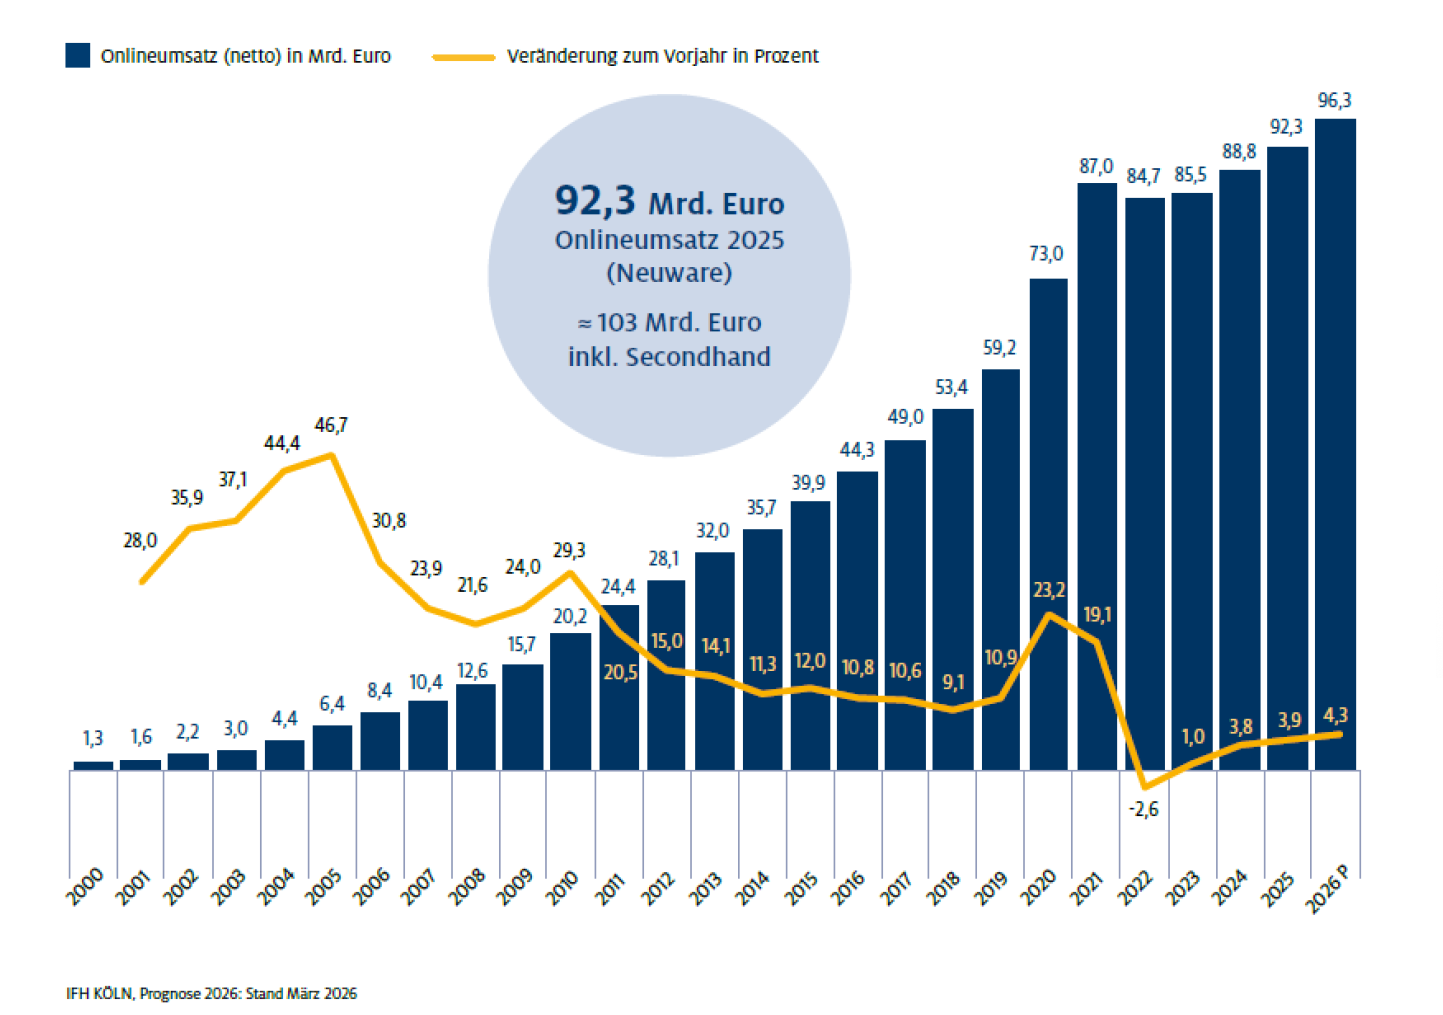
German online retail generated €92.3 billion in net revenue during 2025, up from €88.8 billion in 2024. HDE expects the market to grow another 4.3% in 2026, taking revenue to €96.3 billion.
The market has now recovered from the post-pandemic decline recorded in 2022. Revenue remains €19.3 billion above its 2020 level.
German online retail revenue from 2020 to 2026
| Year | Online revenue | Annual change | Change in revenue |
| 2020 | €73.0 billion | 23.2% | €13.8 billion |
| 2021 | €87.0 billion | 19.1% | €14.0 billion |
| 2022 | €84.7 billion | -2.6% | -€2.3 billion |
| 2023 | €85.5 billion | 1.0% | €0.8 billion |
| 2024 | €88.8 billion | 3.8% | €3.3 billion |
| 2025 | €92.3 billion | 3.9% | €3.5 billion |
| 2026 forecast | €96.3 billion | 4.3% | Approx. €4.0 billion |
The sharp increases of 2020 and 2021 were exceptional. Germany has now moved into a slower but more stable phase of e-commerce growth.
For a broader view of the market, read our analysis of German e-commerce growth.
Online retail is growing faster than offline retail
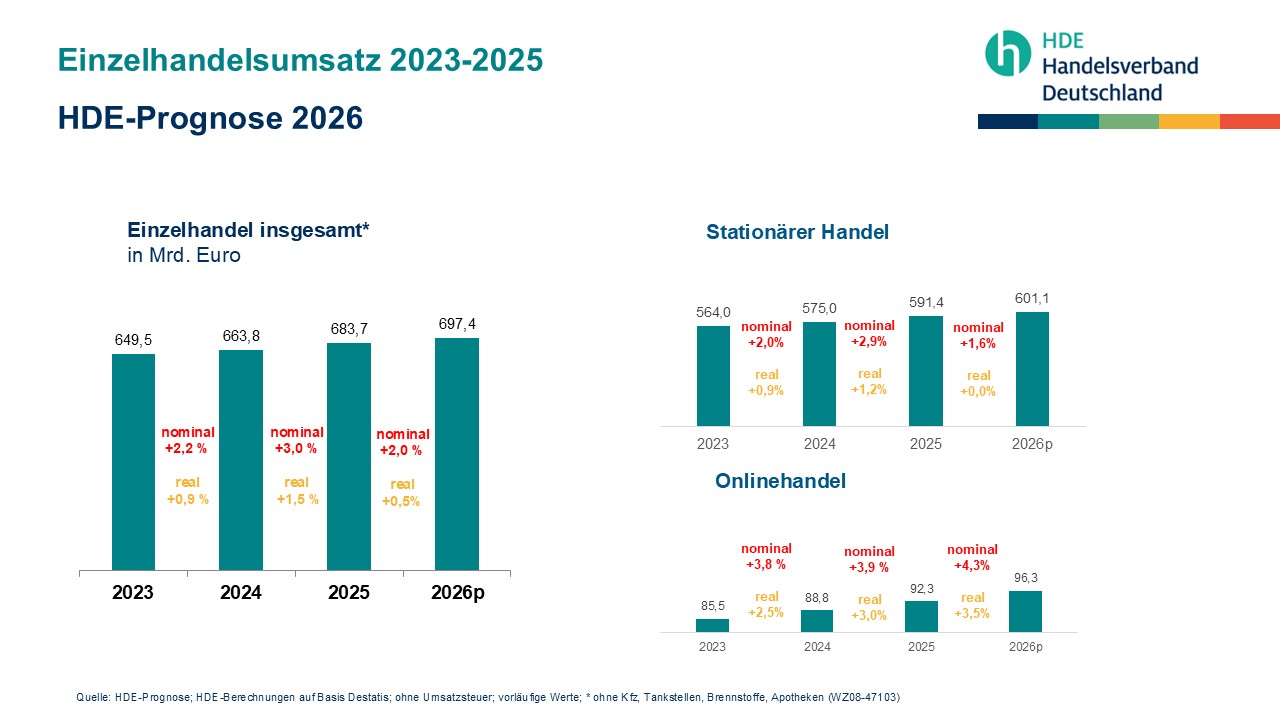
Online sales grew 3.9% in 2025, compared with 2.9% for offline retail. The online share of the wider German retail market increased only slightly, from 13.4% to 13.5%.
The figure changes considerably across categories. Non-food products have a far higher online share than food products. In 2025, 19.1% of non-food spending took place online, compared with 3.2% of food spending.
German online and offline category performance
| Category | Online growth | Online revenue increase | Annual online spend per shopper | Offline growth | Offline revenue change | Annual offline spend per person |
| Fashion and accessories | 2.8% | €0.6bn | €435 | -1.5% | -€0.4bn | €448 |
| Consumer electronics | 2.9% | €0.6bn | €404 | -4.5% | -€1.1bn | €401 |
| Leisure and hobbies | 2.9% | €0.4bn | €282 | -1.1% | -€0.3bn | €384 |
| FMCG | 10.4% | €1.3bn | €258 | 3.0% | €7.6bn | €4,051 |
| Home and furnishings | 1.8% | €0.1bn | €166 | -2.7% | -€0.8bn | €491 |
| DIY and garden | 2.1% | €0.1bn | €68 | -0.9% | -€0.4bn | €677 |
HDE calculates online spend per online shopper aged 14 or older. Offline spend is calculated across the general population aged 14 or older, so the two columns have different population bases.
FMCG was the only major category in the comparison to grow strongly in both channels. Electronics, fashion, home products and leisure goods increased online while losing revenue offline.
Which product categories generate the most online revenue?
Fashion remains Germany’s largest online retail category. It generated €21.2 billion in 2025, equal to 22.9% of online revenue.
Consumer electronics followed with €19.7 billion. Together, fashion and electronics represented 44.2% of the market, down from 44.7% a year earlier. The change reflects faster growth in groceries, health products and other everyday categories.
German e-commerce revenue by category
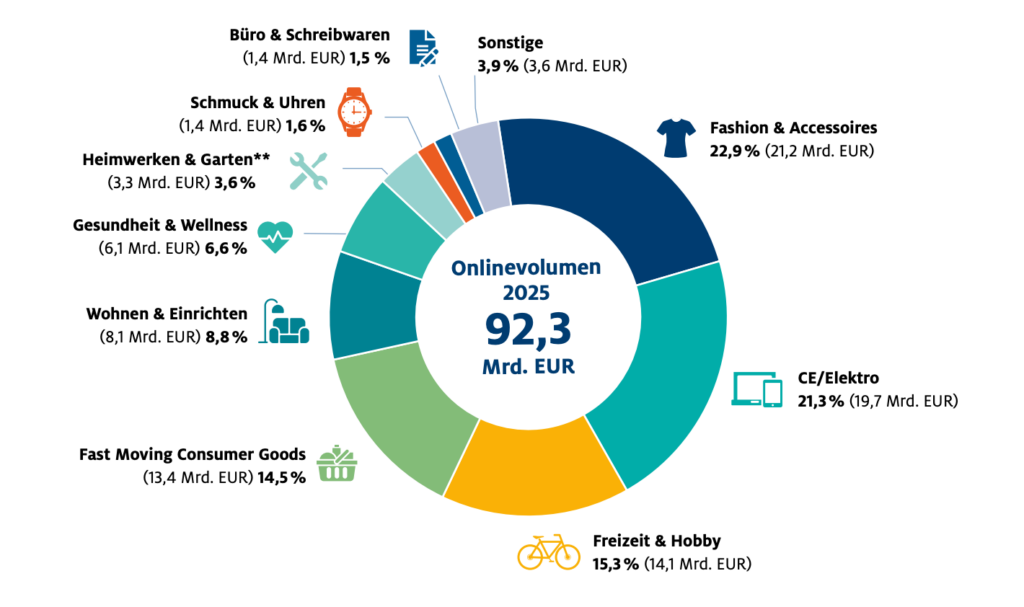
| Category | Online revenue in 2025 | Share of online market | Growth in 2025 |
| Fashion and accessories | €21.2bn | 22.9% | 2.8% |
| Consumer electronics and electrical goods | €19.7bn | 21.3% | 2.9% |
| Leisure and hobbies | €14.1bn | 15.3% | 2.9% |
| Fast-moving consumer goods | €13.4bn | 14.5% | 10.4% |
| Home and furnishings | €8.1bn | 8.8% | 1.8% |
| Health and wellness | €6.1bn | 6.6% | 4.9% |
| DIY and garden | €3.3bn | 3.6% | 2.1% |
| Jewellery and watches | €1.4bn | 1.6% | 3.1% |
| Office supplies and stationery | €1.4bn | 1.5% | 2.4% |
| Other categories | €3.6bn | 3.9% | Not separately reported |
| Total | €92.3bn | 100% | 3.9% |
FMCG was the clear outlier, growing more than 2.5 times faster than the online market average. Health and wellness recorded the second-highest category growth at 4.9%.
See our separate analysis of the most popular online shopping categories in Germany.
How much of each category is purchased online?
A category’s share of total online revenue is not the same as its online penetration.
Electronics and fashion have the highest online shares within their respective markets. FMCG contributes €13.4 billion to e-commerce, but online sales still represent only 4.9% of total FMCG spending.
Online share of each German retail category
| Category | Online share in 2024 | Online share in 2025 | Change |
| Consumer electronics | 43.2% | 45.1% | +1.9 pp |
| Fashion and accessories | 43.1% | 44.2% | +1.1 pp |
| Office supplies and stationery | 37.3% | 38.9% | +1.6 pp |
| Jewellery and watches | 36.7% | 37.6% | +0.9 pp |
| Leisure and hobbies | 23.8% | 24.3% | +0.5 pp |
| Home and furnishings | 20.9% | 21.6% | +0.7 pp |
| Health and wellness | 17.2% | 17.5% | +0.3 pp |
| DIY and garden | 7.4% | 7.6% | +0.2 pp |
| FMCG | 4.6% | 4.9% | +0.3 pp |
Electronics and fashion are mature online categories. Groceries and health products have much more room to move online, even when their percentage growth is already higher.
Which German e-commerce categories have the most growth potential?
Some categories already have high online penetration but relatively little growth. Others are growing rapidly from a small base.
Emerging and mature online product groups
| Product group | Online share in 2025 | Average annual growth, 2023–2025 | Market position |
| Drugstore goods | 4.1% | 13.2% | Low penetration, high growth |
| Food and delicacies | 2.7% | 10.7% | Low penetration, high growth |
| Medical supplies | 5.0% | 8.1% | Low penetration, high growth |
| Children’s clothing | 55.5% | 2.6% | High penetration, slower growth |
| Musical instruments | 54.0% | 2.4% | High penetration, slower growth |
| Photography products | 51.1% | 2.2% | High penetration, slower growth |
| Leather goods and accessories | 41.6% | 1.0% | Mature online category |
| Shoes | 37.1% | -0.7% | High penetration, declining |
The contrast is important for retailers. A low online share does not mean low demand. In groceries, drugstore goods and medical supplies, it may point to a market still shifting from physical to digital purchasing.
How important are marketplaces in German e-commerce?
Marketplaces accounted for 56.7% of German online retail revenue in 2025. Marketplace sales increased 5.9%, while the remaining online market grew 0.9%.
Sales completed through marketplaces grew more quickly than sales attributed to any individual retailer format.
Growth by online retail format
| Format | Revenue growth in 2025 |
| Sales through marketplaces | 5.4% |
| Retailers with physical-store origins | 4.0% |
| Online-first retailers | 3.9% |
| Manufacturers selling directly online | 3.8% |
The categories overlap in HDE’s framework. A physical retailer can sell through its own shop and a marketplace, while marketplace revenue is assigned to the seller’s original retail format.
Origin of non-marketplace online sellers
| Seller format | 2020 | 2024 | 2025 |
| Online-first businesses | 56.5% | 54.9% | 55.0% |
| Retailers with physical-store origins | 33.7% | 34.9% | 34.9% |
| Manufacturers | 9.8% | 10.2% | 10.1% |
The market shares have changed very little since 2020. Online-first businesses still generate more than half of non-marketplace e-commerce revenue.
Amazon and marketplace share of German online retail
| Channel | 2024 | 2025 |
| Amazon.de direct retail | 17.2% | 17.2% |
| Amazon.de Marketplace | 45.5% | 46.1% |
| Other marketplaces | 10.6% | 10.8% |
| Remaining online retail | 26.7% | 25.9% |
| All marketplaces | 56.1% | 56.7% |
HDE’s institutional Amazon view includes some sales from other European countries, so the 63.3% combined Amazon figure should not be interpreted as a simple domestic market-share calculation. The report uses it to illustrate Amazon’s scale within the German online retail ecosystem.
Our guide to the leading online marketplaces in Germany covers the platforms behind these figures.
Are physical retailers still selling online?
Forty per cent of German physical retailers sold goods online in 2025. The share was unchanged from 2024 but below its 45% peak in 2020.
Among physical retailers with online sales, 58% operated their own online shop. The figure fell from 66% in 2024, suggesting that some retailers are relying more heavily on external platforms or withdrawing from direct e-commerce.
Online activity among physical retailers
| Year | Physical retailers selling online | Online sellers using their own shop |
| 2010 | 33% | 77% |
| 2018 | 40% | 63% |
| 2020 | 45% | 62% |
| 2022 | 44% | 65% |
| 2024 | 40% | 66% |
| 2025 | 40% | 58% |
The number of retailers using e-commerce has increased only modestly since 2010. The mix of channels has changed more than the total adoption rate.
How many people shop online in Germany?
Destatis reports that 86% of people aged 16 to 74 had purchased something online at least once in 2025. Seventy per cent had bought online within the previous three months.
The adoption rate is highest among people aged 25 to 44. Older shoppers are less active, but their participation continues to increase. HDE found that the number of online shoppers aged over 55 grew 3.1% in 2025, compared with 1.2% growth across all shoppers.
Online shopping adoption by age
| Age group | Internet users | Internet users in previous three months | Have shopped online | Shopped online in previous three months |
| Total, 16–74 | 97% | 95% | 86% | 70% |
| 16–24 | 98% | 97% | 87% | 71% |
| 25–44 | 99% | 98% | 94% | 82% |
| 45–64 | 97% | 95% | 86% | 68% |
| 65–74 | 90% | 87% | 68% | 50% |
The difference between “has ever shopped online” and “shopped online recently” matters. Claims that almost every German adult shops online usually refer to internet access or a narrower survey sample rather than recent shopping activity.
Online shopping adoption by gender
| Group | Have shopped online | Shopped online in previous three months |
| Women aged 16–74 | 85% | 70% |
| Men aged 16–74 | 87% | 71% |
| Women aged 25–44 | 94% | 84% |
| Men aged 25–44 | 94% | 79% |
| Women aged 65–74 | 63% | 45% |
| Men aged 65–74 | 73% | 56% |
Gender differences are small across the total population but become more visible among the oldest age group.
How frequently do Germans order online?
The average German online shopper placed 35.2 orders in 2025. That works out at almost three orders per month.
Average spending reached €53.20 per order. Multiplying the two figures gives an indicative annual spend of around €1,873 per active shopper, although actual spending varies widely across categories and consumer groups.
| Shopping metric | 2025 figure |
| Average online orders per shopper | 35.2 a year |
| Approximate monthly order frequency | 2.9 orders |
| Average spend per order | €53.20 |
| Indicative annual spend | Approx. €1,873 |
| Growth in the number of online shoppers | 1.2% |
| Growth among shoppers aged over 55 | 3.1% |
Growth is coming less from adding first-time digital buyers and more from higher spending among people already shopping online.
How important is cross-border e-commerce in Germany?
Cross-border shopping is common, but consumers do not always realise that an order is being shipped from another country.
Twenty-six per cent of surveyed shoppers said they deliberately ordered from foreign retailers in 2025. Another 39% discovered only after ordering that the retailer was located abroad.
German attitudes towards cross-border shopping
| Behaviour | 2024 | 2025 |
| Consciously order from foreign retailers | 24% | 26% |
| Have unknowingly ordered from abroad | 42% | 39% |
| Have not ordered abroad but would consider it | 15% | 18% |
| Have not ordered abroad and would not consider it | 19% | 17% |
Foreign online sellers generated an estimated €10.9 billion from German shoppers in 2025, representing 11.8% of online retail revenue under HDE’s definition.
Most common countries used for cross-border orders
| Country | Share of German cross-border shoppers ordering there |
| China | 49% |
| France | 22% |
| Netherlands | 19% |
| Austria | 15% |
| Italy | 15% |
| Spain | 13% |
| United States | 13% |
| Poland | 11% |
| United Kingdom | 10% |
China leads by a wide margin. France and the Netherlands are the most common European sources.
Temu and Shein statistics for Germany
Temu and Shein generated an estimated €4.7 billion in German online sales during 2025. Together, they represented around 5% of the total market.
HDE estimates that 16 million people in Germany bought from at least one of the two platforms.
| Temu and Shein metric | 2024 | 2025 |
| German shoppers | 14.4 million | 16.0 million |
| Average spend per order | €24.95 | €34.15 |
| Average orders per shopper | 8.35 | 8.51 |
| Estimated parcels per day | 400,000 | 460,000 |
| Estimated German revenue | €3.0 billion | €4.7 billion |
| Approximate market share | 3.4% | 5.0% |
Of the 16 million shoppers, approximately 13.5 million bought from Temu, 7 million bought from Shein and 4.5 million used both.
Germany also had 20.9 million monthly Temu users during the reported 2025 period, up from 16.3 million in the previous comparison period. Shein reached 22.2 million German monthly users, compared with 16 million earlier.
Mobile commerce statistics for Germany
Mobile devices generated 69% of German online retail revenue in 2025.
Smartphones alone accounted for 61% of online revenue, up from 47% in 2020. Desktop and laptop devices fell from 45% to 31%, while tablets remained unchanged at 8%.
Online revenue by device
| Device | Share in 2020 | Share in 2025 |
| Smartphone | 47% | 61% |
| PC or laptop | 45% | 31% |
| Tablet | 8% | 8% |
| All mobile devices | 55% | 69% |
Smartphones generated €56.7 billion in online revenue during 2025. All other devices combined generated €35.6 billion.
Mobile websites versus shopping apps
| Smartphone purchasing channel | 2024 | 2025 |
| Shopping apps | 48% | 50% |
| Mobile websites | 52% | 50% |
Apps did not replace the mobile web. German smartphone purchases are now split equally between apps and websites.
Retailers need both a strong mobile site and a useful app strategy. See the top shopping apps in Germany for examples from the market.
Social media use by age in Germany
The platform mix changes sharply between age groups. YouTube reaches 89% of internet users aged 16 to 19, while Instagram reaches 85% and TikTok reaches 66%.
Facebook has the opposite age profile. Only 7% of 16- to 19-year-olds use it, compared with 52% of people aged 60 to 69.
Social media platform use by age
| Age group | YouTube | Snapchat | TikTok | |||
| 16–19 | 89% | 85% | 68% | 66% | 63% | 7% |
| 20–29 | 78% | 75% | 45% | 45% | 44% | 32% |
| 30–39 | 76% | 71% | 15% | 28% | 25% | 61% |
| 40–49 | 68% | 62% | 11% | 20% | 23% | 67% |
| 50–59 | 64% | 52% | 4% | 22% | 22% | 61% |
| 60–69 | 48% | 30% | 1% | 8% | 17% | 52% |
The data also shows why a single social-commerce strategy cannot cover the full German population. Platform selection needs to reflect the age of the customer rather than general platform popularity.
For further context, see our guide to social commerce in Germany.
Influencer and social-commerce statistics
Thirteen per cent of German internet users reported buying a product after discovering it through a social media post.
The strongest response came from people aged 30 to 39. Almost one in four people in that group had made an influencer-assisted purchase.
| Age group | Purchased after discovering a product through social media |
| 16–19 | 17% |
| 20–29 | 16% |
| 30–39 | 23% |
| 40–49 | 14% |
| 50–59 | 7% |
| 60–69 | 4% |
| Average | 13% |
The results challenge the idea that influencer commerce belongs only to teenagers. Millennials currently show the strongest link between social discovery and completed purchases.
TikTok Shop statistics for Germany
TikTok Shop entered Germany in March 2025. Six months after launch, 52% of surveyed internet users recognised the service and 9% had already bought from it.
Estimated 2025 revenue reached approximately €220 million. Average spending was €59 per purchase.
| TikTok Shop metric | 2025 figure |
| Consumers aware of TikTok Shop | 52% |
| Consumers who had purchased | 9% |
| Browsed but had not purchased | 11% |
| Aware but had not used it | 32% |
| Unaware of TikTok Shop | 49% |
| Average spend per purchase | €59 |
| Bought once or twice | 51% of buyers |
| Bought three to five times | 39% |
| Bought more than five times | 10% |
| Estimated revenue | Approx. €220 million |
Rounding means the awareness categories total slightly more than 100%.
The five most commonly purchased product groups were:
- Clothing and accessories
- Cosmetics and personal care
- Sports and leisure products
- Consumer electronics
- Drinks, snacks and confectionery
Read more about TikTok Shop usage in Germany.
AI shopping statistics in Germany
Sixty per cent of German internet users aged 16 to 69 had used AI tools such as ChatGPT, Gemini or Claude by October 2025.
Twenty-six per cent used them regularly, while 34% had tried them at least once. Among people aged 16 to 19, regular usage reached 53%.
Awareness and use of AI tools
| AI usage status | Share of internet users |
| Use AI regularly | 26% |
| Have used AI at least once | 34% |
| Know about AI but have not used it | 34% |
| Have not heard of the tools | 6% |
| Regular use among 16- to 19-year-olds | 53% |
Among people familiar with AI, 28% could imagine using it to shop for many types of product. Another 34% would use it for a smaller selection of products.
Potential use of AI for shopping
| Attitude | Share of AI-aware consumers |
| Would use AI for many products | 28% |
| Would use AI for selected products | 34% |
| Would not use AI for shopping | 38% |
AI-assisted product research is already more than a future scenario. Thirty-five per cent of consumers use AI chatbots to research purchases.
What German consumers research with AI
| Research activity | Share of AI product researchers |
| Comparing product features | 64% |
| Assessing product quality | 58% |
| Comparing prices | 51% |
| Checking shop reliability | 38% |
| Finding shop recommendations | 31% |
| Checking delivery and return conditions | 24% |
| Other activities | 3% |
Retailers competing for visibility will need structured product data that AI systems can interpret. Our guide explains how German retailers can prepare product feeds for AI-assisted shopping.
Secondhand e-commerce statistics
The German online secondhand market generated €10.5 billion in 2025. Revenue increased 5.3%, faster than the 3.9% growth recorded for new products.
The market has almost doubled since 2019, when online secondhand revenue stood at €5.7 billion. Its average annual growth rate over the period was 10.6%.
Online secondhand revenue in Germany
| Year | Online secondhand revenue |
| 2019 | €5.7bn |
| 2020 | €7.0bn |
| 2021 | €8.7bn |
| 2022 | €9.1bn |
| 2023 | €9.3bn |
| 2024 | €9.9bn |
| 2025 | €10.5bn |
Share of secondhand online revenue by product category
| Category | Share of secondhand revenue |
| Books | 17% |
| Fashion and accessories | 16% |
| Consumer electronics | 12% |
| Home and furnishings | 7% |
| Games, sports, baby products and other goods | 4% |
| DIY and garden | 3% |
Secondhand spending is no longer driven only by environmental concerns. Lower prices and household budget pressure are also moving consumers towards used products.
Returns and return-cost statistics
Returns remain a major operational cost for German e-commerce. Earlier national research found that approximately 11% of online purchases were returned, although rates vary widely across categories. Fashion and footwear generate a much higher volume than groceries or consumer products with standard specifications.
The latest HDE research shows that shipping and return charges change where and how Germans buy online.
Consumer response to higher shipping and return costs
| Consumer reaction | 2024 | 2025 |
| Avoid shops with high shipping and return costs | 41% | 40% |
| Research the product more carefully | 16% | 19% |
| Use store delivery or in-store returns | 12% | 12% |
| Order less often but place larger orders | 12% | 12% |
| Buy fewer products | 6% | 9% |
| Continue shopping without changes | 13% | 7% |
More shoppers are researching products before buying, while fewer say that higher charges would leave their behaviour unchanged.
Retailers can reduce avoidable returns through better product descriptions, measurements, comparison tools, reviews and visual content. Read our analysis of what online returns look like in Germany.
Payment statistics for Germany
The Bundesbank’s 2025 study covers day-to-day payments across online and offline channels, so its results are not a pure e-commerce payment-method ranking.
It still shows the wider move towards digital payments. For the first time, cashless methods accounted for more than half of recorded purchases in Germany.
| Payment metric | 2025 figure |
| Purchases paid without cash | 55% |
| Purchases paid with cash | 45% |
| Debit-card share of transactions | 26% |
| Mobile-payment share | 10% |
| Increase in mobile payments since 2023 | 4 percentage points |
| E-payment method share | 6% |
| Debit-card share of payment value | 28% |
| Cash share of payment value | 23% |
| Credit-transfer share of payment value | 23% |
| PayPal share of e-payment methods | Approx. 86% |
Separate EHI/ECDB research into Germany’s 1,000 largest online shops found that PayPal was offered by 95% of the shops studied. Apple Pay was available in more than one-third, while Google Pay recorded a 63% increase in availability.
Germany’s largest online shops
EHI and ECDB reported that Germany’s 1,000 largest online shops generated €80.4 billion in net e-commerce revenue during the 2024 financial year, almost 4% more than a year earlier.
The ten largest shops captured 38.8% of that revenue. The largest 100 generated 70.7%, showing how concentrated German e-commerce remains.
| Market concentration metric | Figure |
| Revenue of the top 1,000 shops | €80.4bn |
| Growth of top 1,000 revenue | Almost 4% |
| Share generated by the top 10 | 38.8% |
| Share generated by the top 100 | 70.7% |
| Growth among the top 10 | 8.0% |
| Growth among the remaining 990 | 1.3% |
Leading German online shops by net sales
| Online shop | Reported 2024 net e-commerce sales |
| Amazon.de | €15.0bn |
| Otto.de | €4.4bn |
| Zalando.de | €2.6bn |
| MediaMarkt.de | €2.1bn |
| Apple.com | €1.7bn |
| Ikea.com | €1.4bn |
| Shein.com | €1.1bn |
| Shop-Apotheke.com | Approx. €1.05bn |
| Rewe.de | €920m |
| AboutYou.de | €815m |
Because the EHI shop ranking and HDE total-market estimate use different definitions, the values should not be combined to calculate simple market shares.
See the full ranking of the top 100 online stores in Germany.
What the latest German e-commerce statistics mean for retailers
Germany is no longer seeing pandemic-level e-commerce expansion. Growth has settled into a more predictable range of around 4%, but the headline market figure hides much faster changes underneath.
Marketplaces remain difficult to avoid. More than half of online revenue passes through marketplace environments. Brands need to weigh reach against fees, customer ownership and dependence on platform algorithms.
Everyday categories have more room to move online. Food, drugstore goods and health products start from lower penetration levels but are growing faster than mature categories such as shoes and fashion.
Mobile is the default shopping environment. Smartphones generate 61% of revenue. Mobile websites still handle half of smartphone purchases, so app investment cannot come at the expense of mobile web performance.
AI is becoming part of product discovery. Consumers already use chatbots to compare specifications, quality, prices and shop reliability. Product data now needs to work for machines as well as people.
Older shoppers represent a meaningful source of growth. Adoption among younger groups is close to saturation. The over-55 market is expanding faster, creating demand for clear information, accessible interfaces and trustworthy service.
Frequently asked questions about e-commerce in Germany
How big is the German e-commerce market in 2026?
HDE forecasts that German B2C online retail revenue will reach €96.3 billion in 2026, an increase of 4.3%. The forecast covers new physical and digital goods, excludes services and is reported net of VAT and returns.
How much did German e-commerce generate in 2025?
German online retail generated €92.3 billion in 2025. Revenue increased 3.9%, adding €3.5 billion to the market. Including online secondhand sales, the total was approximately €103 billion.
What percentage of German retail sales take place online?
Online sales represented 13.5% of Germany’s retail market in 2025. The share was 19.1% for non-food products and 3.2% for food products.
What is the largest e-commerce category in Germany?
Fashion and accessories generated the most online revenue in 2025 at €21.2 billion. Consumer electronics followed at €19.7 billion. Together, they accounted for 44.2% of online retail.
Which German e-commerce category is growing fastest?
Fast-moving consumer goods were the fastest-growing major category in 2025. Online FMCG sales increased 10.4%, compared with 3.9% growth across the total market.
How many people in Germany shop online?
Destatis reports that 86% of people aged 16 to 74 had shopped online at least once in 2025. Seventy per cent had purchased something online within the previous three months.
How important are marketplaces in Germany?
Marketplaces accounted for 56.7% of German online retail revenue in 2025. Revenue generated through marketplaces increased 5.9% from the previous year.
Is mobile commerce dominant in Germany?
Yes. Mobile devices generated 69% of online revenue in 2025. Smartphones accounted for 61%, while tablets contributed 8%.
How large is secondhand e-commerce in Germany?
Online secondhand revenue reached €10.5 billion in 2025. It grew 5.3% during the year and has risen from €5.7 billion in 2019.
Are German shoppers using AI to find products?
Thirty-five per cent of consumers surveyed by IFH Köln said they used AI chatbots for product research. Common activities included comparing features, evaluating quality and checking prices.
How frequently do Germans order online?
German online shoppers placed an average of 35.2 orders in 2025, equal to almost three orders a month. Average spending was €53.20 per order.
How popular is cross-border shopping in Germany?
Twenty-six per cent of shoppers consciously ordered from foreign sellers in 2025. Another 39% had ordered abroad without initially realising that the seller was based outside Germany.
Final thoughts
Germany’s online retail market is growing again, but future gains will not be distributed evenly.
Marketplaces and mobile devices already dominate. FMCG, health and secondhand commerce are expanding faster than traditional online categories. At the same time, social platforms, TikTok Shop and AI assistants are creating new paths between product discovery and checkout.
Retailers entering Germany now need more than a translated online shop. They need local payment options, strong marketplace decisions, transparent delivery and returns, mobile-first experiences and product information suited to both shoppers and AI systems.