European e-commerce overview: Benelux
Discover the latest trends and insights in European e-commerce with a focus on the Benelux region. Learn about market dynamics and growth opportunities!

Benelux consists of three monarchies: Belgium, the Netherlands, and Luxembourg. The name Benelux is a consolidation of the shortages from these three member countries. All of them are doing a good job in the case of the economy. But what about Benelux e-commerce? We will find out today.
From simple e-commerce overviews, to customer behavior, payment methods, social media usage, and logistics – we will cover all of that. So, let’s start with Belgium.
Benelux e-commerce: Belgium
Overview
Belgium’s e-commerce landscape has experienced notable growth, which, by the way, reflects the country’s robust digital infrastructure and consumer adaptability. The market generated $9,361 million in revenue in 2024, with the growth forecast at 5-10%. And in August 2025 alone, the monthly e-commerce revenue was $841 million. Good news: this country’s e-commerce is expected to go higher and higher.
The sectoral distribution within Belgium’s e-commerce market is diverse. The Hobby & Leisure segment leads, accounting for 25% of the total revenue. But to the top categories we can also add:
- Electronics
- Fashion
- Furniture & Homeware
- DIY
- or Care Products
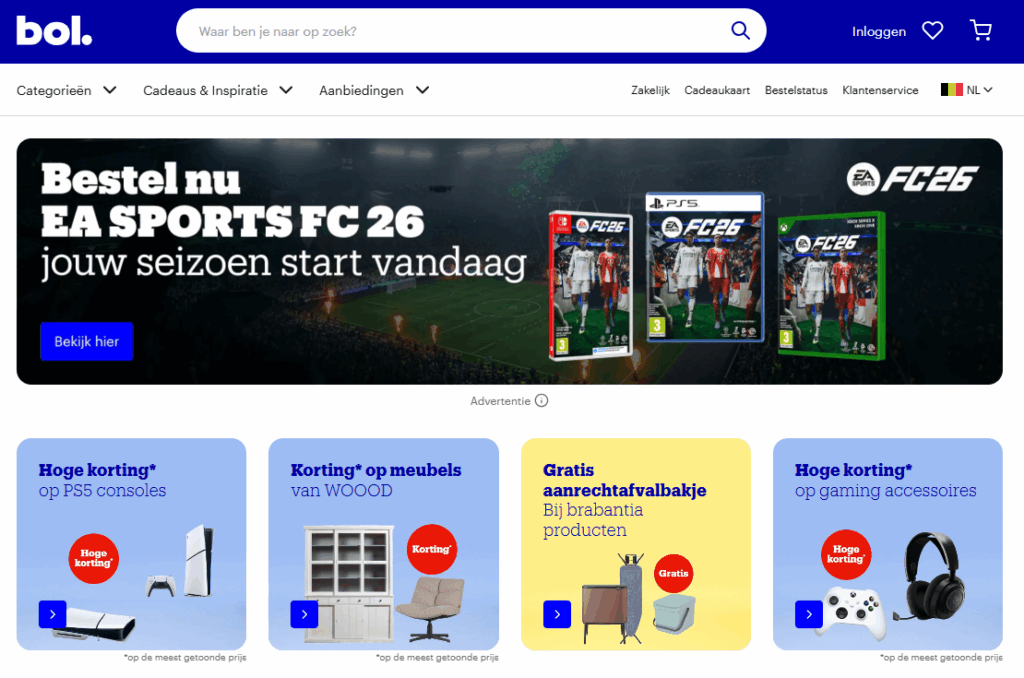
If we have touched on the topic of top categories, now let’s cover the top stores. On the podium are bol.com, amazon.com.be, and coolblue.be. And as we can see, the first place belongs to bol.com, so indeed, the Hobby & Leisure category is king in this country.
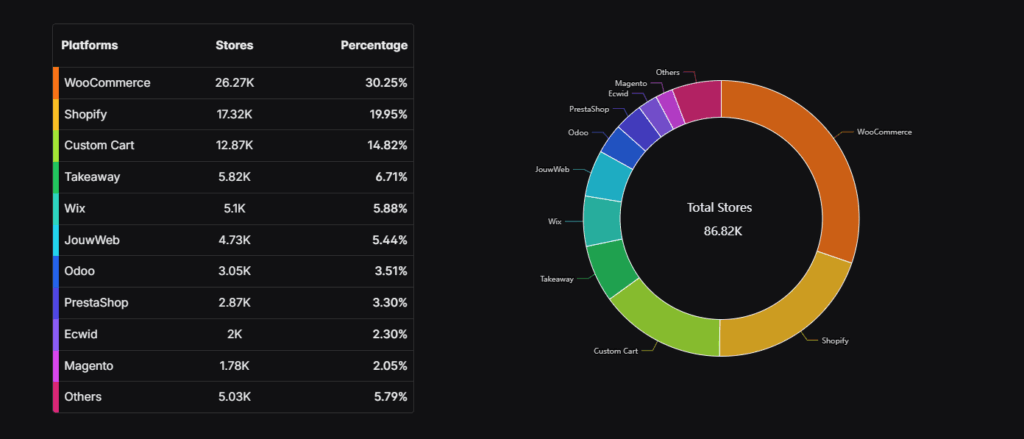
In terms of platform usage, in Belgium, WooCommerce hosts approximately 30.25% of Belgian online stores, totaling around 26,270 stores. Shopify follows with a 19.95% share, supporting about 17,320 stores. Custom Cart platforms account for 14.82%, equating to approximately 12,870 stores.
Consumer behavior
Belgians appreciate the comfort of shopping and the price. They enjoy shopping 24/7 and saving time thanks to online websites. They also love to compare prices. That is why if you want to win Belgians’ hearts, your e-commerce needs to have reasonable and clear pricing, and all included costs, such as shipping and delivery, as fast as possible.
Belgian shoppers are getting choosy. 64% say sustainability is a key factor in their purchasing decisions. They’re more aware of food waste, too — 71% admit they think about that impact. Moreover, because of the cost-of-living squeeze, many are hunting deals. 65% now buy private-label or low-cost brands, up from 63% the prior year. And 64% of shoppers say they visit multiple physical stores to compare offers and find bargains.
What’s interesting, resale and recommerce are rising. Belgium’s recommerce market is forecast to hit $1.20 billion by 2025, growing at ~11.7% CAGR through 2029. That signals more consumers are buying used, refurbished, or secondhand goods.
Payment methods
The payment landscape in Belgium is characterized by a blend of traditional and digital methods, which reflects both consumer trust and technological advancement.
First, in 2025, 84% of Belgians prefer digital payments over cash in stores. Cash is slowly fading from everyday checkout. Among digital modes, contactless card payments are now firmly part of Belgian life: 60% say they’ve used contactless in the past week, and 77% feel comfortable using it. Plus, mobile pays are climbing. Over one in two Belgians (55%) have tried mobile payments via QR codes or contactless on devices. Specifically, 48% have used QR payments (up from 42%). And among younger customers (16-24), mobile payments are especially attractive.
Online, Bancontact remains king. It’s typically cited as Belgium’s top e-commerce payment method, with roughly 78% preference share among local online shoppers. Debit and credit cards (Visa/Mastercard) pick up when buying internationally or in global services. Wallets like PayPal or mobile wallet options are rising, but still secondary to local solutions.
Social media
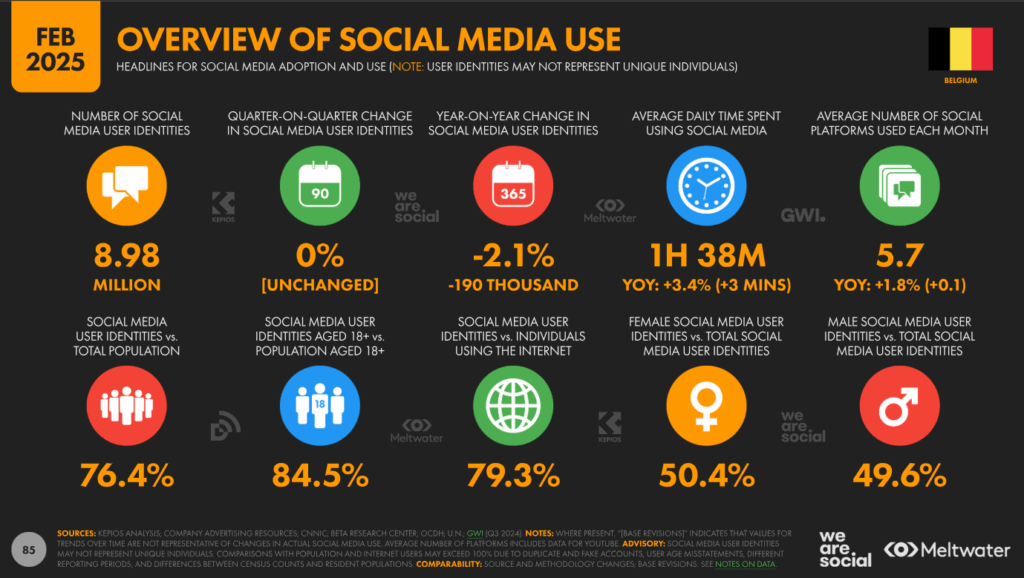
As of January 2025, there were 8.98 million social media users in Belgium, accounting for 76.4% of the total population. Facebook, Instagram, and YouTube are the most utilized platforms for product discovery and information. Specifically, YouTube boasts 8.98 million users, while TikTok has 3.71 million users aged 18 and above, covering 39.1% of the adult demographic.
The rise of social commerce is evident, with consumers increasingly making purchases directly through social media platforms. This trend is particularly pronounced among younger demographics, who value seamless shopping experiences integrated within their social media interactions.
Logistics
Efficient logistics are the backbone of Belgium’s e-commerce sector. The country benefits from a strategic location in Western Europe, with robust infrastructure supporting both domestic and cross-border e-commerce activities.
The Belgian government has implemented regulations to promote transparency and sustainability in e-commerce logistics. One notable measure requires online retailers to offer at least two delivery options at the time of purchase and to disclose the CO2 emissions associated with logistics. This initiative aims to make e-commerce more eco-friendly and aligns with the growing consumer demand for sustainable practices.
Benelux e-commerce: Netherlands
Overview
First: this is a big, mature market. The Dutch e-commerce industry is estimated at €36.5 billion in 2025, making up around 31% of total retail spending. And projections indicate a substantial increase to $81.94 billion by 2032. Adoption is high, too. In late 2024, 86.7% of Dutch consumers had made an online purchase (16-75 age group). That’s well above the EU average and shows how normalized online buying is in NL.
Cross-border shopping is a major feature. Around 68% of Dutch shoppers buy from international retailers, especially in categories like fashion, home & garden, and personal care. That means Dutch e-commerce isn’t isolated – global reach matters.
In addition, social commerce is heating up. The Netherlands’ social commerce market is projected to hit $7.39 billion by 2025, growing at ~20.6% annually. So, doing “shop on Instagram / TikTok” is increasingly real, not just hype.
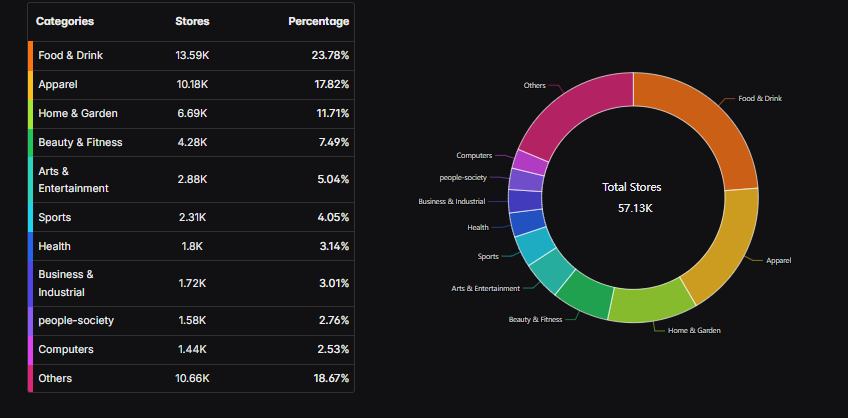
As for the top e-commerce categories, we have here Fashion & Beauty, Food & Beverages, Electronics, and Home Goods & Garden. Another source mentions – surprisingly – Travel & Tickets, Food, and Insurance. Next, to the top three e-commerce stores, we can count bol.com, amazon.nl, and ah.nl. No big changes here regarding Belgium’s top e-commerce stores.
Platform & store distribution is interesting too. In 2025, in NL the top categories in store numbers:
- Food & Drink
- Apparel
- and Home & Garden
What about consumer behavior?
Consumer behavior
Have you ever wondered how the Dutch approach online shopping? Their online shopping behavior reflects a more conservative approach compared to other European countries.
Dutch buyers are getting more budget-sensitive. A recent YouGov survey found that budget awareness sits at the top of concerns for households: many say they track spending more, compare more, and prioritize deals. Yet, when prices rise, they don’t always cut spending – sometimes they trade down (less premium) or shift categories. They just prefer mid-value purchases now more often. In 2025, 38% of Dutch online orders fall in the “€50+” range, and 30% in the €25–49 band — the low-cost bracket (< €10) shrank to ~7%. That signals they’re buying fewer cheap impulse items and opting for something “worth it.”
Sustainability and identity matter too. Dutch consumers are more comfortable expressing who they are. They tend to invest in experiences over things, and many choose products aligned with their values (local, eco, fair). Going further, essentials like groceries, price, convenience, and sustainability are key drivers for supermarket behavior in 2025. Dutch shoppers say they want easy shopping, good deals, but also minimal waste & greener packaging.
As Belgians, they’re also more open to recommerce / secondhand markets. The recommerce market in the Netherlands is forecast to hit $2.99 billion in 2025, growing at ~13.1% annually. That indicates more people are buying used, refurbished, or circular goods.
Payment methods
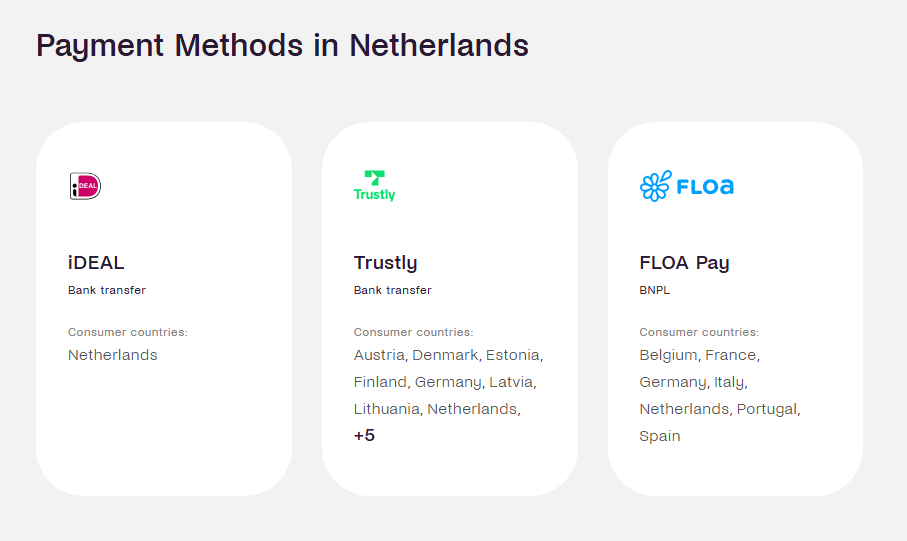
Imagine doing your weekly online shop in NL. You hit checkout — odds are, you’ll pick iDEAL, the homegrown bank-transfer method. It’s so entrenched that it handles around 58% of online transactions there. Because iDEAL connects directly to Dutch banks, it’s seamless, trusted, and gives merchants real-time confirmation. To the trusted services belong also Trustly (bank transfers) and FLOA Pay (buy now, pay later).
Now, think of card payments. They’re not the first go-to online in NL. But they are climbing, especially debit card use. In 2024, the Dutch made 306 million online card payments worth €24 billion. Among those, debit card payments tripled vs 2022, hitting ~76 million transactions. In physical stores, cards dominate too: 81% of POS payments are card-based (including contactless).
And contactless is huge – by the end of 2024, 94% of all card payments were contactless.
What about more flexible methods? Buy Now, Pay Later (BNPL) is striking a chord in NL, especially for fashion, electronics, and bigger buys. The market is projected to reach $10.29 billion in 2025 (growing ~14% year-on-year) there.
And digital wallets? They’re growing too. Think Apple Pay, Google Pay, PayPal — these are more often used in mobile flows or for convenience where card entry feels clunky.
Social media
As of January 2025, there were approximately 14.8 million social media users in the Netherlands, accounting for 80.9% of the total population. Platforms like YouTube, Facebook, Instagram, and LinkedIn are particularly popular. These platforms are not just for socializing; they’re pivotal for product discovery and influencing purchasing decisions.
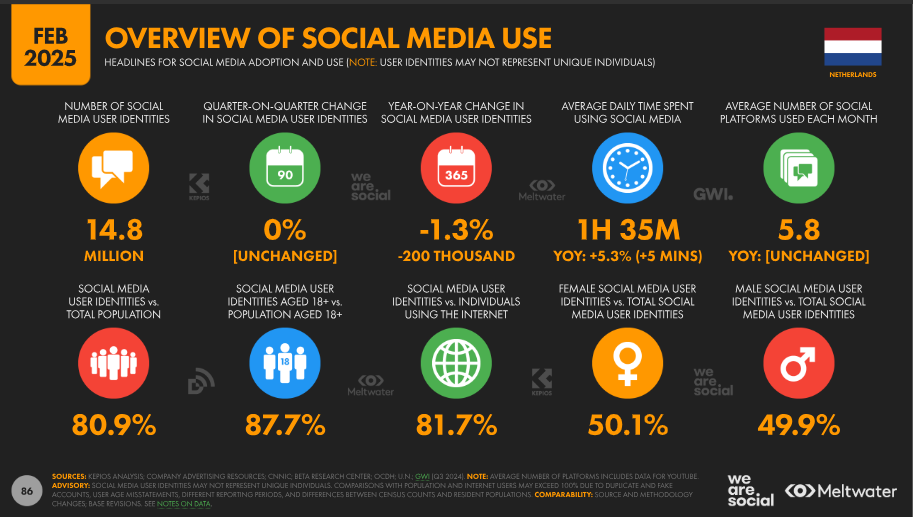
In early 2025, YouTube had 14.8 million users in the Netherlands. Facebook had 8.05 million users – as many as Instagram – LinkedIn had 13.0 million users, and Snapchat had 7.44 million users. After them was TikTok, with 5.62 million users. The main reason for using social media was keeping contact with friends and family, and filling spare time.
Logistics
Thanks to a prime location and strong connectivity (sea, rail, road, air), the Netherlands is a gateway for goods flowing into Europe. According to a market report, the Dutch freight & logistics market is expected to hit $53.62 billion in 2025, growing steadily thereafter.
Ports and intermodal play huge roles. The Port of Rotterdam still anchors much of the trade, and container volume is expected to reach 16.65 million TEU by 2025, reinforcing the Netherlands’ role as a European entry point. Schiphol, too, is a major air cargo node — especially for high-value goods.
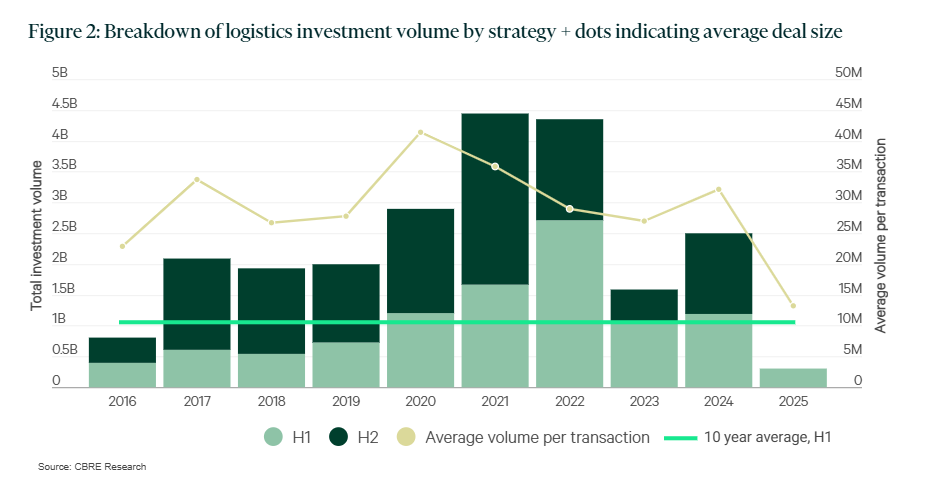
Investment in logistics real estate is interesting right now. In 2024, investment in industrial & logistics properties jumped to €3.1 billion, up ~74% from 2023. For 2025, similar volumes are expected, with focus shifting towards light industrial and urban logistics / last-mile sites.
Still, not everything is smooth. Vacancy rates in the logistics/industrial space rose to 4.5% in Q2 2025, though that’s still considered low compared to many European peers (avg ~5.2%). Also, logistics‐specific investment in H1 2025 was only €305 million — the lowest level in a decade.
So in short: NL’s logistics scene is evolving and pushing into urban & smart spaces, but it’s also dealing with serious constraints.
Benelux e-commerce: Luxembourg
Overview
Luxembourg, though small in size, boasts a dynamic and rapidly evolving e-commerce landscape. As of 2025, the e-commerce market in Luxembourg is projected to generate approximately $1,214 million in revenue. This growth trajectory is expected to continue, with forecasts indicating a compound annual growth rate (CAGR) of up to 5% between 2024 and 2025.
What’s being sold, and how are shops distributed? “Store count by category” data suggests Apparel is the top segment — in 2025, approx 289 online apparel stores, making up ~20.6% of all online stores in Luxembourg. Other strong categories include Food & Drink and Home & Garden
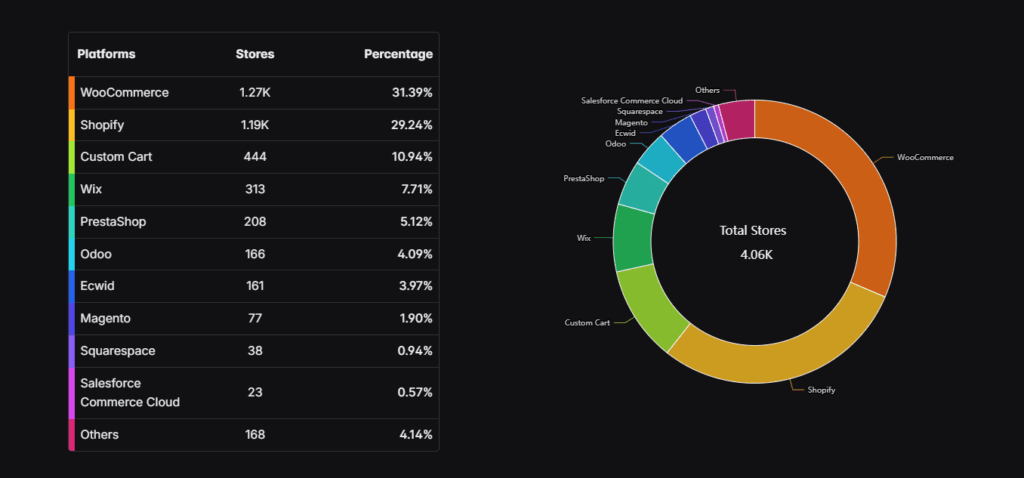
In terms of platform usage, WooCommerce hosts approximately 31.39% of Luxembourg’s online stores, totaling around 1,270 stores. Shopify follows closely with a 29.24% share, supporting about 1,190 stores. Custom Cart platforms account for 10.94%, equating to approximately 444 stores.
Luxembourg is deeply digital: internet penetration hits ~98.9% in early 2025, meaning almost everyone is online. Among those, e-commerce participation is high — e-commerce Europe notes ~83% of Luxembourgers are e-shoppers.
Cross-border dynamics matter too: Luxembourg is small and centrally located, so many local online purchases are fulfilled from abroad or by international retailers. Research notes that Luxembourg’s e-commerce market gains from “closeness to important e-commerce markets” (e.g., Germany) and easy access by foreign merchants.
Consumer behavior
Luxembourg’s shoppers learn values-first. In 2025, 53% said they prioritise responsible consumption and even look at product reparability when choosing what to buy—well above the EU average of 43%. You see it in everyday choices: people check labels, ask about durability, and expect brands to back up eco claims. New EU rules targeting greenwashing only fuel that mindset, making “prove it” the default.
Even though e-commerce is growing, Luxembourgers still love the tactile feel of in-store shopping. That said, many are mixing channels. That tells you: click-to-cart isn’t fully replacing shopping.
Sustainability keeps threading through choices. Across Europe in 2025, recyclable packaging ranked as the top eco attribute for consumers, and Luxembourg fits that pattern—eco-minded, but practical. Shoppers want items that last, packaging that’s easy to recycle, and claims they can trust. If you’re selling in LU, make durability and recyclability crystal clear, because people are looking for it.
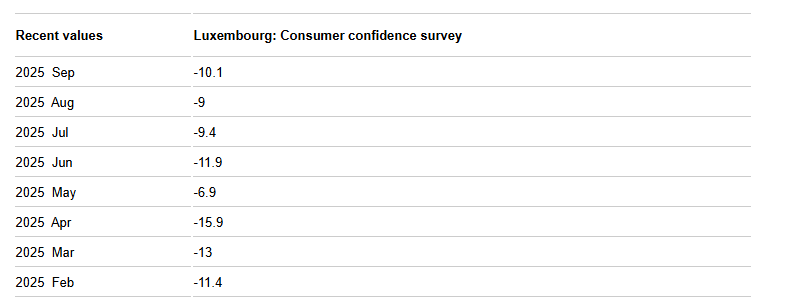
And confidence is a bit of a roller coaster. The consumer confidence index climbed slightly in August 2025, partly because people felt slightly better about their past finances; yet their intentions to make major purchases dipped. In August 2025, the survey showed confidence at –9 points, up a little from around –9.4 in July.
Payment methods
In terms of value, in Luxembourg, cards still run the show in stores (they have a share of 45%). On the other hand, cash slipped to 52% of POS transactions. Moreover, mobile jumped from 4% to 7%. Luxembourg mirrors that drift toward plastic-and-phone over banknotes, and the ECB’s latest payment snapshot shows card volumes rising again into late 2024.
On phones, the story gets more local. For years, Payconiq powered tap-and-scan moments in Luxembourg. Now the big pivot is coming: the country’s five major banks plan to migrate to Wero by 2026, a Europe-wide wallet that will plug into everyday P2P and, next, retail flows. Expect more QR and instant account-to-account use cases to sit alongside cards rather than replace them overnight.
Social media
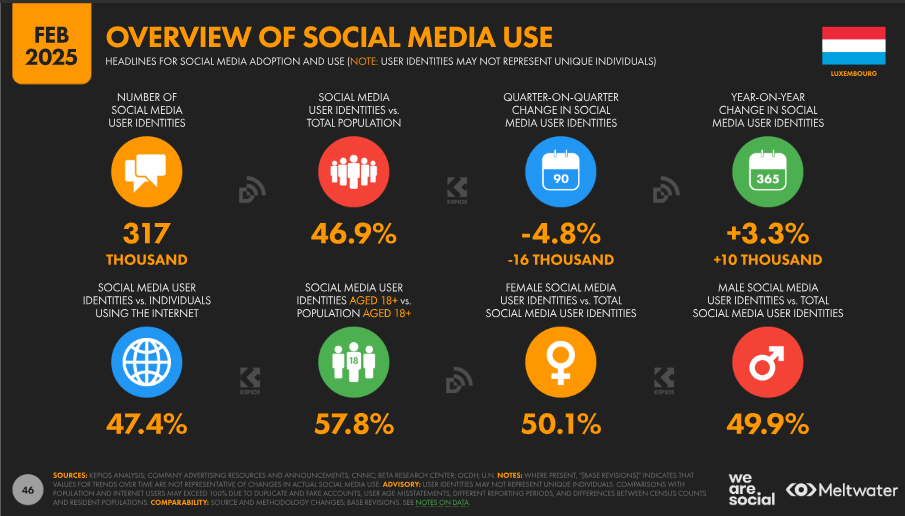
As of February 2025, there are approximately 317,000 social media users, making up 46.9% of the total population. Platforms like Facebook, Instagram, and LinkedIn are popular, serving as both social connectors and e-commerce facilitators. At the beginning of 2025, Facebook had 317 thousand users, Instagram had 276 thousand users, LinkedIn had 440 thousand users, and TikTok had 181 thousand users.
Businesses leverage these platforms for targeted advertising, product launches, and customer engagement. The integration of shopping features within social media apps has further streamlined the online shopping experience. Users can purchase products without leaving the platform.
The influence of social media on purchasing decisions is notable. Consumers often rely on reviews, influencer endorsements, and peer recommendations before making a purchase. This trend underscores the importance for businesses to maintain a positive online presence and engage actively with their audience.
Logistics
The country’s strategic location in Europe, coupled with its advanced infrastructure, facilitates smooth logistics operations. However, we can spot some challenges.
The rise of e-commerce has prompted logistics providers to innovate. Many are adopting sustainable practices, such as electric delivery vehicles and optimized routing, to reduce carbon footprints. Additionally, the development of urban warehouses ensures quicker delivery times, meeting the high expectations of modern consumers.
Luxembourg punches above its weight as a logistics node. Air cargo sets the tone: home-carrier Cargolux posted $3.324 million revenue and $448 million profit for 2024, one of its strongest non-COVID years – so the main hub stays busy and well-funded going into 2025. On the ground, the Bettembourg–Dudelange intermodal platform keeps Europe plugged in; it handled 219,730 units in 2024, running 24/7 with six rail tracks and a 33-hectare footprint. That combo (profitable long-haul air plus dense railroad switching) explains why shippers treat Luxembourg as a reliable pivot.
Last words about Benelux e-commerce
Benelux e-commerce is compact, connected, and fast to react. Belgium feels like a savvy lab for value and sustainability. Shoppers compare, read reviews, and care about impact. The Netherlands brings scale and speed. Adoption is high, testing is constant, and new formats spread quickly once they prove ROI. Luxembourg stays small but punchy. Cross-border assortment fills gaps, and omnichannel plays build trust. Across the region, brands win when they keep proofs close at hand: real performance and real clarity.
If you’re planning moves here, think local nuances first. In Belgium, mind language splits and regional habits. In the Netherlands, move quickly with seasonal drops and product refreshes. In Luxembourg, widen choice with smart cross-border assortment and clean product data.
Four simple rules help: go local with content and support; lead with proof and social proof; track the full journey, not only clicks; keep product pages sharp on specs and availability.
Treat Benelux as a cluster with shared rails and distinct tastes. Do that, and you’ll feel momentum build without shouting.
We hope that we have helped you understand how e-commerce works in each Benelux country. If you want to know more about other countries, you can read similar texts, e.g., about Austria or France.
***